Overview
This project built a full customer segmentation system for telecom CVM operations. It had two phases: unsupervised clustering to discover behavioral segments, then supervised classification to assign new customers to those segments using interpretable business rules.
The main challenge was not the clustering algorithm. It was the series of design decisions that came before and after: defining what one row should represent, making variables compatible with distance-based methods, iterating until clusters became operationally meaningful, and bridging the unsupervised output to a production-ready assignment system.
The project combined representation design, variable shaping, clustering experimentation, telecom-specific profiling, and supervised rule extraction to produce actionable segment structures rather than just mathematical clusters.
Architecture
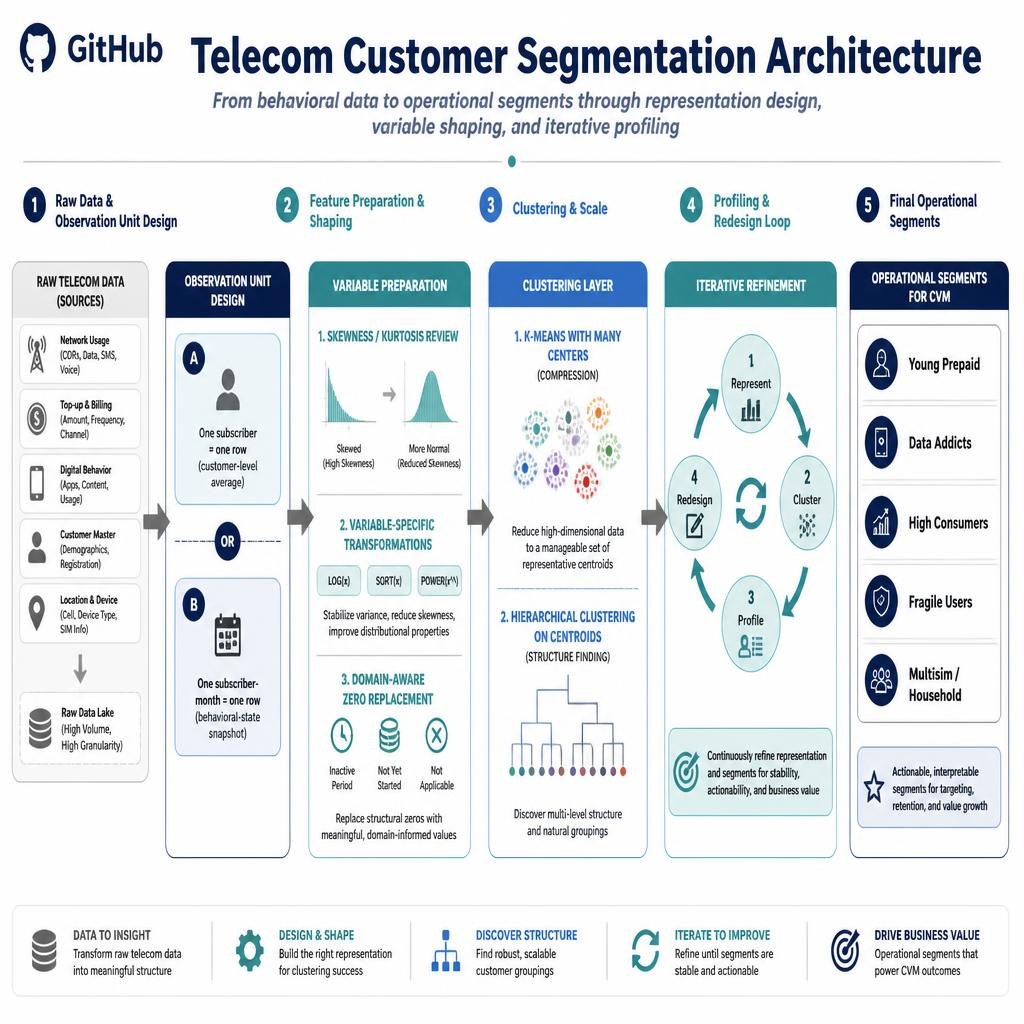
The Core Idea
The first segmentation question was not about the clustering method.
It was about a more fundamental design choice: what should one observation represent? Whether the variables can even coexist in a shared distance space? Whether the clusters, once produced, actually mean something to the business? And how to make the segmentation production-ready for customers who arrive after the model was built?
Each of these questions required a different type of thinking:
- Observation-unit design — a customer average or a monthly behavioral state
- Variable clusterability — making distributions compatible with distance methods
- Iterative profiling — turning statistical clusters into business-readable identities
- Supervised assignment — bridging unsupervised output to production scoring
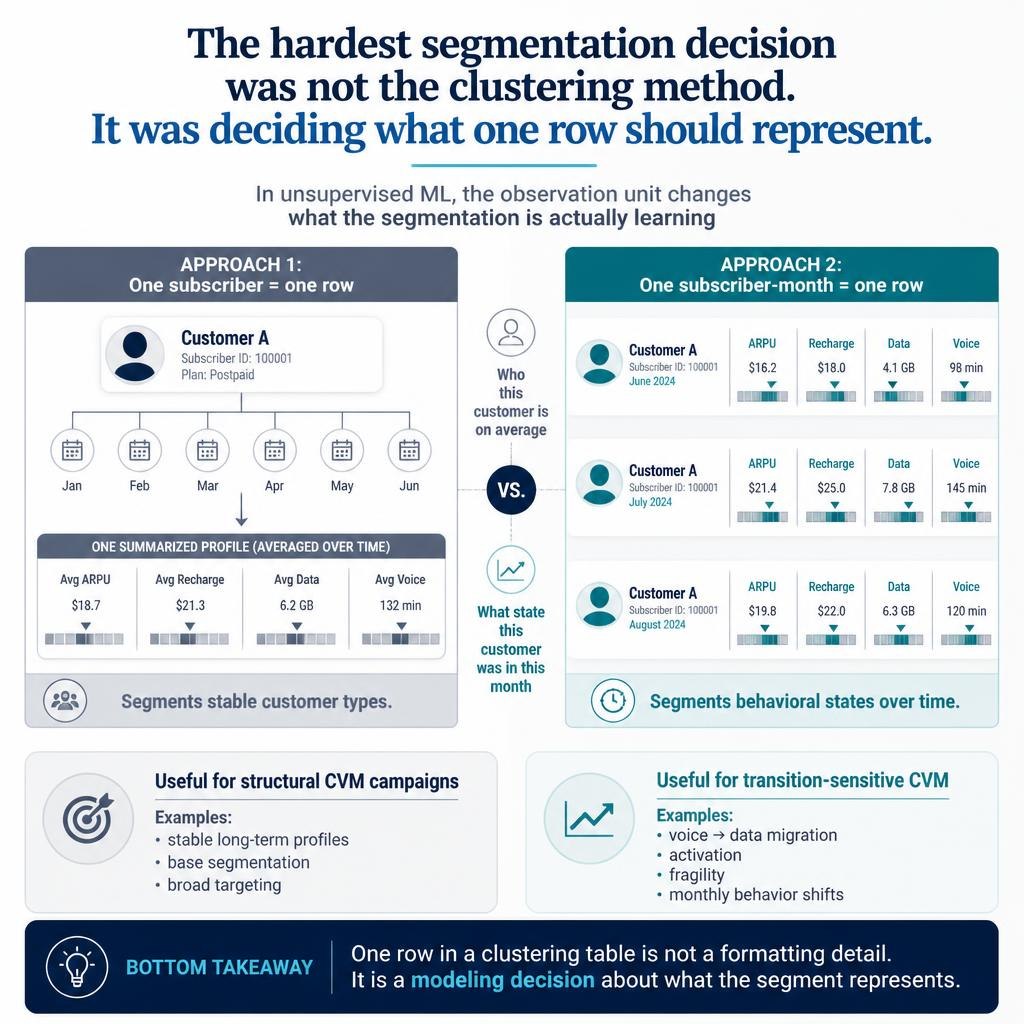
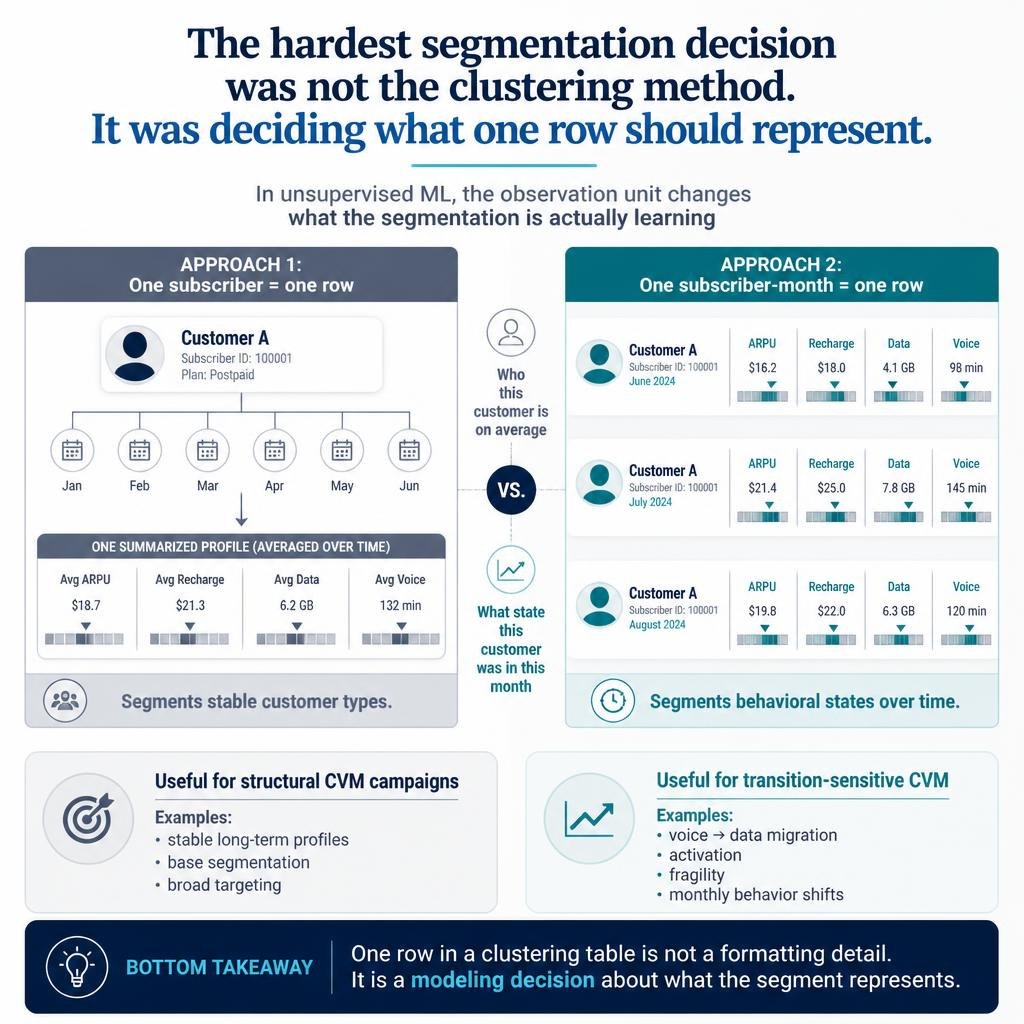
Observation Unit Design
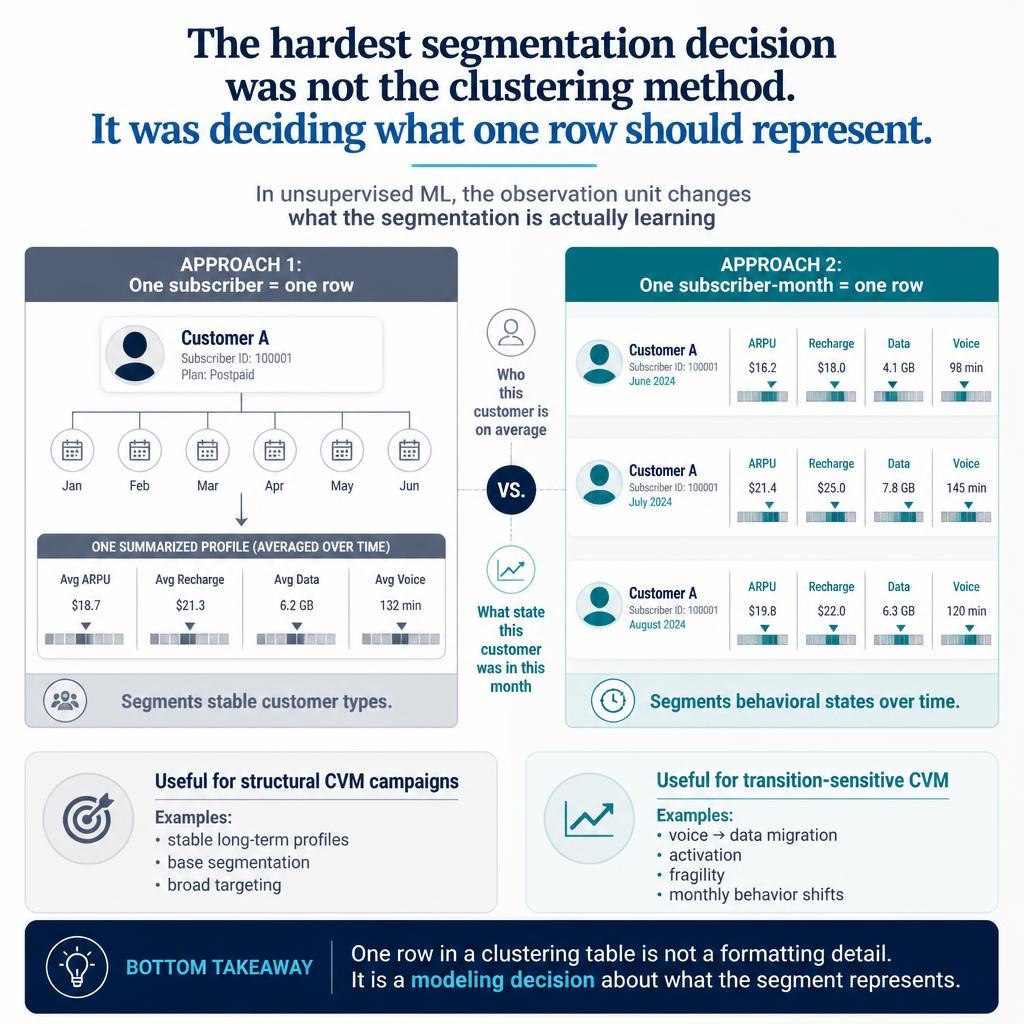
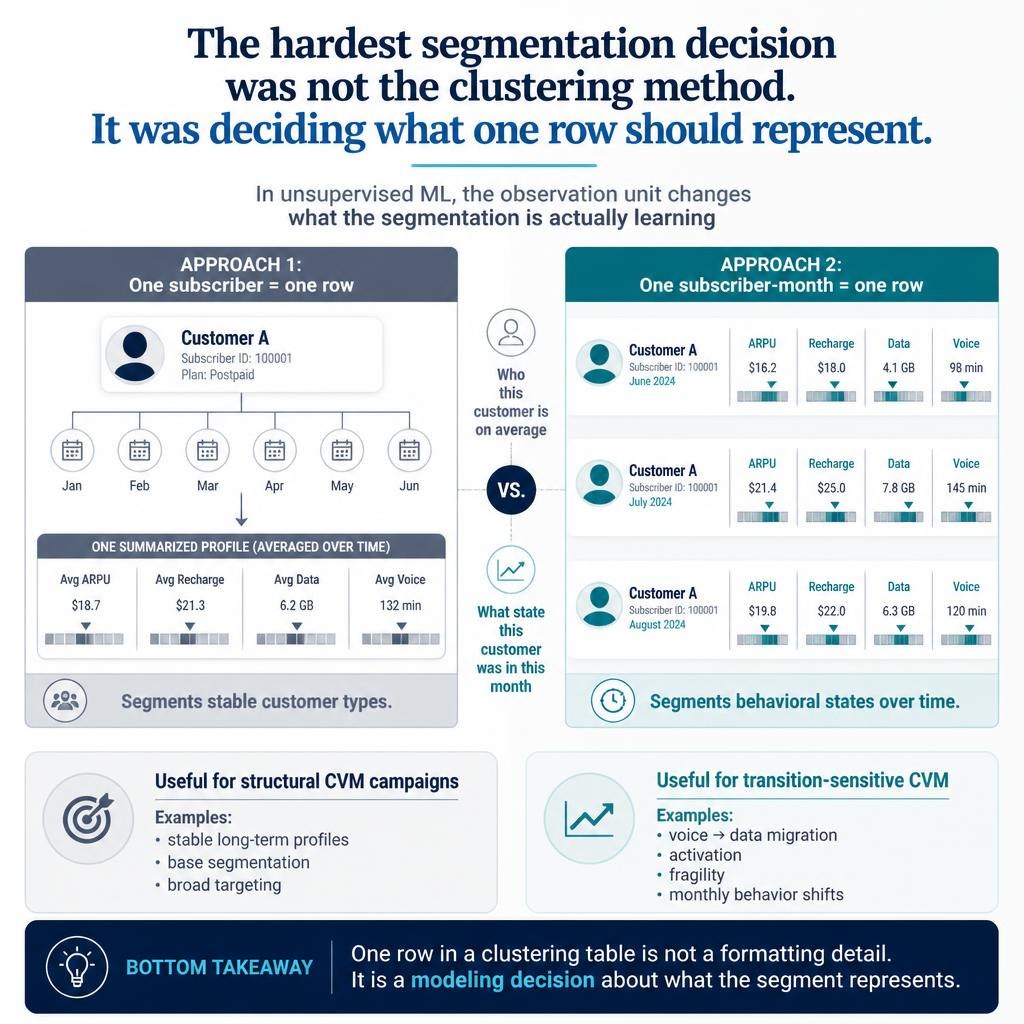
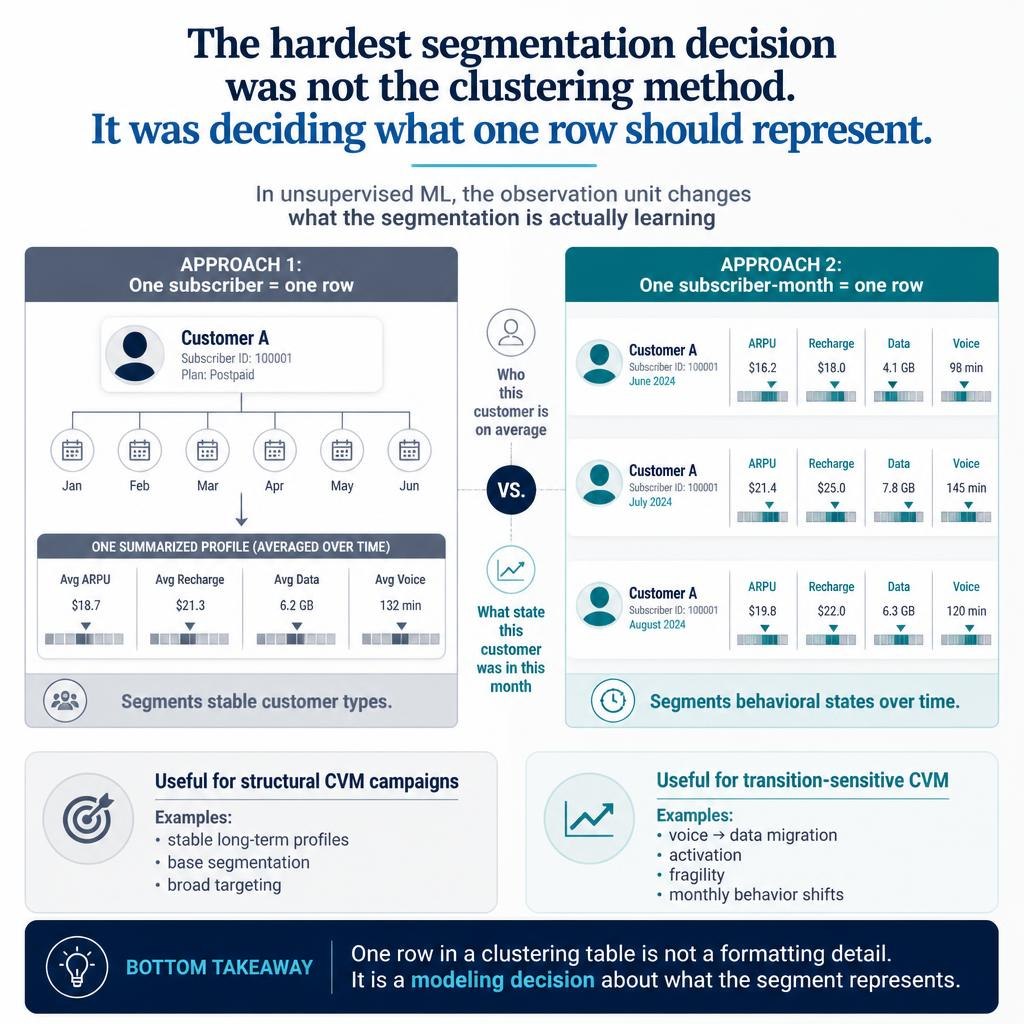
With months of behavioral history per subscriber, the first design question was: what exactly should one row in the analytical base table represent?
Two valid approaches
Approach A — One Subscriber = One Row
Collapse the behavioral window into one profile per customer: average usage intensity, average recharge frequency, average data consumption.
What you segment: customers as stable entities.
Good for: long-term CVM strategy, structural campaigns, customer typology.
Approach B — One Subscriber-Month = One Row
Keep each monthly snapshot as a separate observation. The same subscriber in March, April, and May becomes three different rows.
What you segment: behavioral states over time.
Good for: detecting transitions, early warning signals, lifecycle modeling.
That single design decision changes the entire segmentation output.
Selected code: aggregated subscriber behavioral profile
/* Approach A: one subscriber = one row */
/* Collapse N months into average behavioral profile */
select subscriber_id,
       sum(recharge_amount) / history_months       as avg_recharge_amount,
       sum(recharge_count) / history_months        as avg_recharge_count,
       sum(recharge_days) / history_months         as avg_recharge_days,
       sum(weekend_recharge) / history_months      as avg_weekend_recharge,
       case when sum(recharge_count) > 0
            then sum(recharge_amount) / sum(recharge_count)
            else 0 end                             as avg_recharge_value,
       case when sum(recharge_count) > 0
            then sum(recharge_days) / total_days_in_window
            else 0 end                             as recharge_frequency
from subscriber_recharge_monthly
group by subscriber_id;
Design insight: The question "which clustering method?" must come after the question "does the business need stable customer types or changing customer states?" The unit of analysis is a modeling decision, not a formatting detail.
Iterative Profiling and Redesign
Useful segments did not emerge from running one clustering method once. The final segmentation came from repeated cycles of representation, clustering, profiling, and redesign.
The business cannot act on Cluster 1, Cluster 2, Cluster 3. Operations needs identities it can recognize: young prepaid users, data-heavy consumers, old loyal subscribers, multisim households, fragile low-activity profiles.
The iteration loop
Profiling dimensions per iteration
- Recharge behavior — frequency, regularity, weekend patterns, top-up value distribution
- Voice vs data mix — usage intensity by service type, on-net vs off-net split
- Handset quality — 2G / 3G / 4G device capability, device change frequency
- Network community — graph degree, community size, operator mix in social group
- Region and mobility — geographic footprint, number of distinct cell towers visited
- CVM response — campaign sensitivity, offer activation behavior, response to promotions
- Churn signals — inactivity days, declining usage trends, recharge evaporation patterns
Design insight: Unlike supervised learning, there is no target variable to tell you whether the representation is right. Good segmentation is designed through iteration. The iteration is not optional — it is the method.
Variable Clusterability
The raw feature space had extreme distributions. Some variables were wildly skewed. Before reducing redundancy, the project answered: can these variables even live in the same clustering space?
Variable-specific transformation strategy
LOG
Moderate skew (1–3)
Applied to: avg call duration, community size, cell tower count, SMS volume
SQRT
Light skew
Applied to: active days ratio, 4G usage percentage, off-net duration share
Power ^0.25
Heavy skew (5+)
Applied to: recharge amount, total revenue, total data volume
EXP
Reverse / compressed
Applied to: multi-SIM flag, data pack percentage, 3G usage percentage
Design insight: In distance-based unsupervised learning, bad variable shape is often a bigger problem than variable redundancy. Before asking whether two variables are too similar, make sure each one is even representable in a stable distance space.
Compression Before Structure
With hundreds of thousands of subscribers, hierarchical clustering cannot run directly. K-means scales linearly but flattens nested structure. The solution: use both in sequence.
Stage 1: K-Means Compression
Compress the full subscriber base into many representative centroids. Fast, scalable, captures local density patterns.
Stage 2: Hierarchical Clustering (Ward)
Run Ward's method on the centroids. Finds nested structure, natural segment boundaries, optimal cluster count.
Selected code: two-stage clustering
/* Stage 1: K-means compression */
proc fastclus data=normalized_subscriber_features
     maxclusters=1000
     out=compressed_centroids;
  var feature_1 - feature_49;
run;

/* Stage 2: Hierarchical clustering on centroids */
proc cluster data=compressed_centroids
     method=ward
     outtree=dendrogram_output;
  var feature_1 - feature_49;
run;

/* Cut dendrogram at chosen level */
proc tree data=dendrogram_output
     nclusters=8
     out=final_segment_assignment;
run;
Design insight: The first algorithm is not the segmenter — it is the reducer. One algorithm can serve as a modeling layer for another.
Supervised Rule-Based Assignment
The unsupervised phase gave meaningful clusters. But clusters alone cannot operationally assign new customers. So the supervised phase extracted interpretable rules and applied them as a production scoring system.
The bridge: from clusters to rules
1. Label
Assign unsupervised segment identities as supervised target.
2. Train
Fit decision tree. Compare with NN and regression benchmarks.
3. Extract
Extract splitting rules with conditions and thresholds.
4. Adjust
Round to business-meaningful values. Validate with CVM teams.
Design insight: Discovery is unsupervised. Assignment is supervised. The bridge is rule extraction with business-adjusted thresholds.
Key Takeaway
The hardest segmentation decision was not the clustering method.
It was defining what one row should represent, making the variables clusterable, iterating until clusters became operational segments, and then bridging unsupervised discovery to supervised rule-based assignment for production use.
Public Repository Scope
This public version shares the segmentation architecture, methodological framing, selected pseudocode, and project presentation. Raw telecom data, confidential schemas, monetary values, and production identifiers are not included.