Aggregate → Forecast → Disaggregate
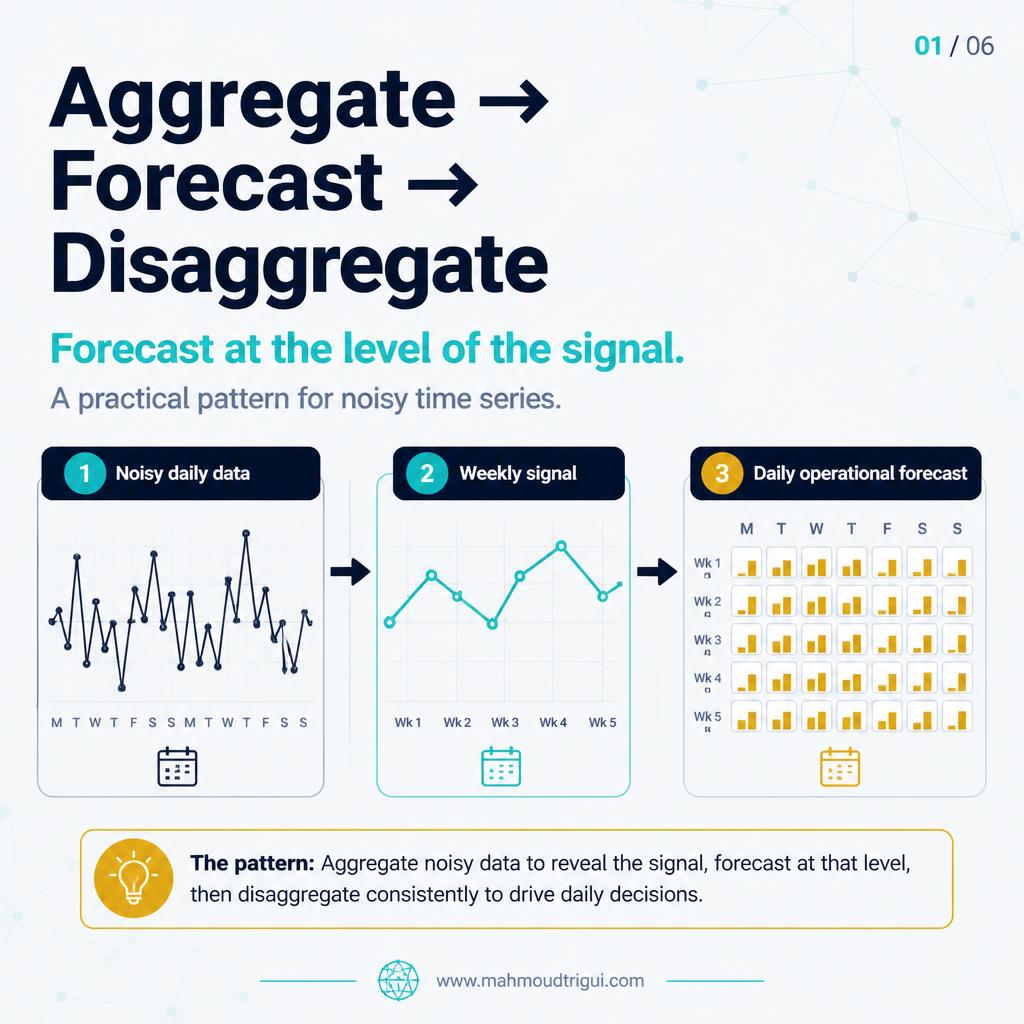
If daily data is noisy, a daily forecast may not be the best place to start. Aggregate to a stable level, forecast the signal, then distribute the forecast back to the operational resolution with a coherent rule.
TL;DR: If daily data is noisy, forcing a forecast model to explain every local spike chases noise instead of signal. Aggregate the series to a level where trend and seasonality are easier to see — daily demand to weekly, hourly to daily — forecast the higher level, then reconcile the forecast back to the operational resolution with a consistent rule such as historical or rolling proportions. Daily values must sum back to the weekly total. Forecast at the resolution of the signal, not by default at the resolution of the data — and backtest aggregation against the direct forecast on the same validation windows.
Visual Summary
The Problem
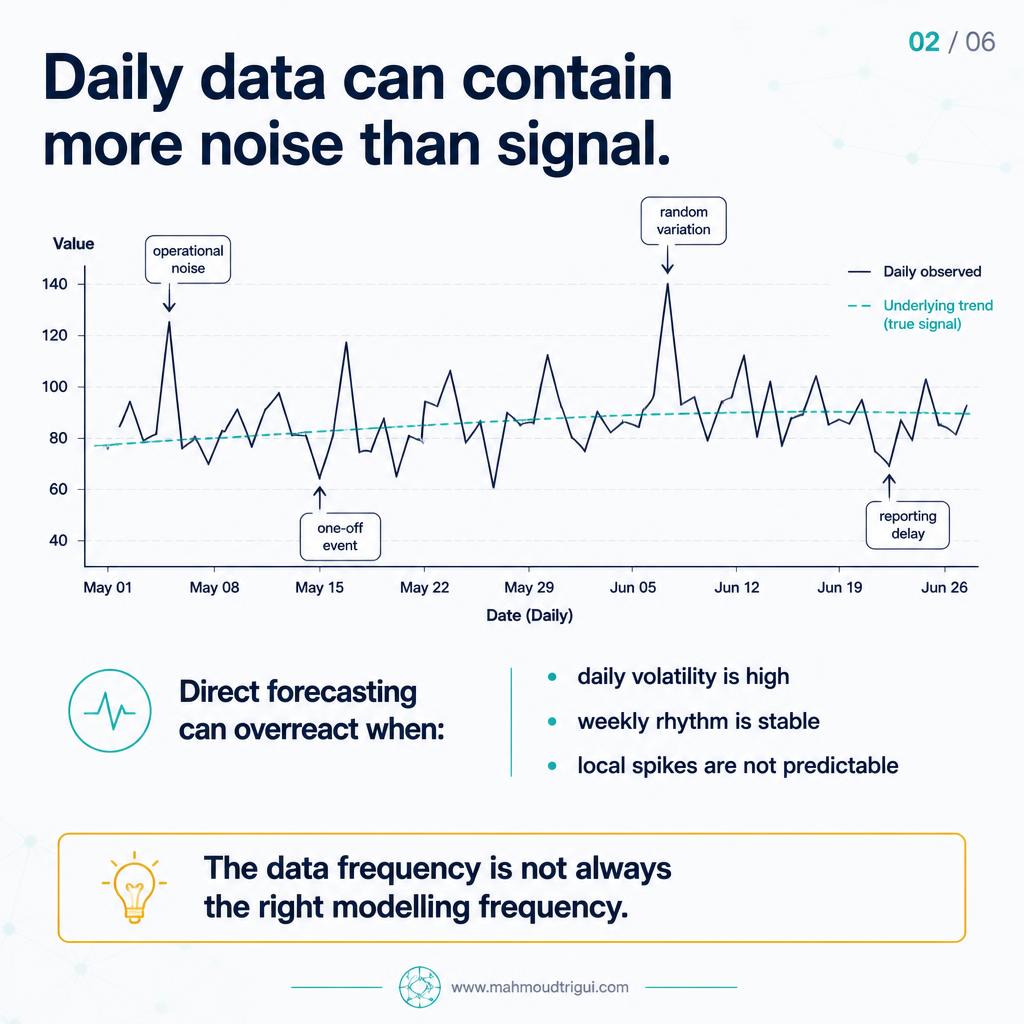
If daily data is noisy, a daily forecast may not be the best place to start. Forcing a model to explain every daily spike — operational noise, one-off events, random variation, reporting delays — makes it chase local fluctuations instead of the signal your decision actually needs.
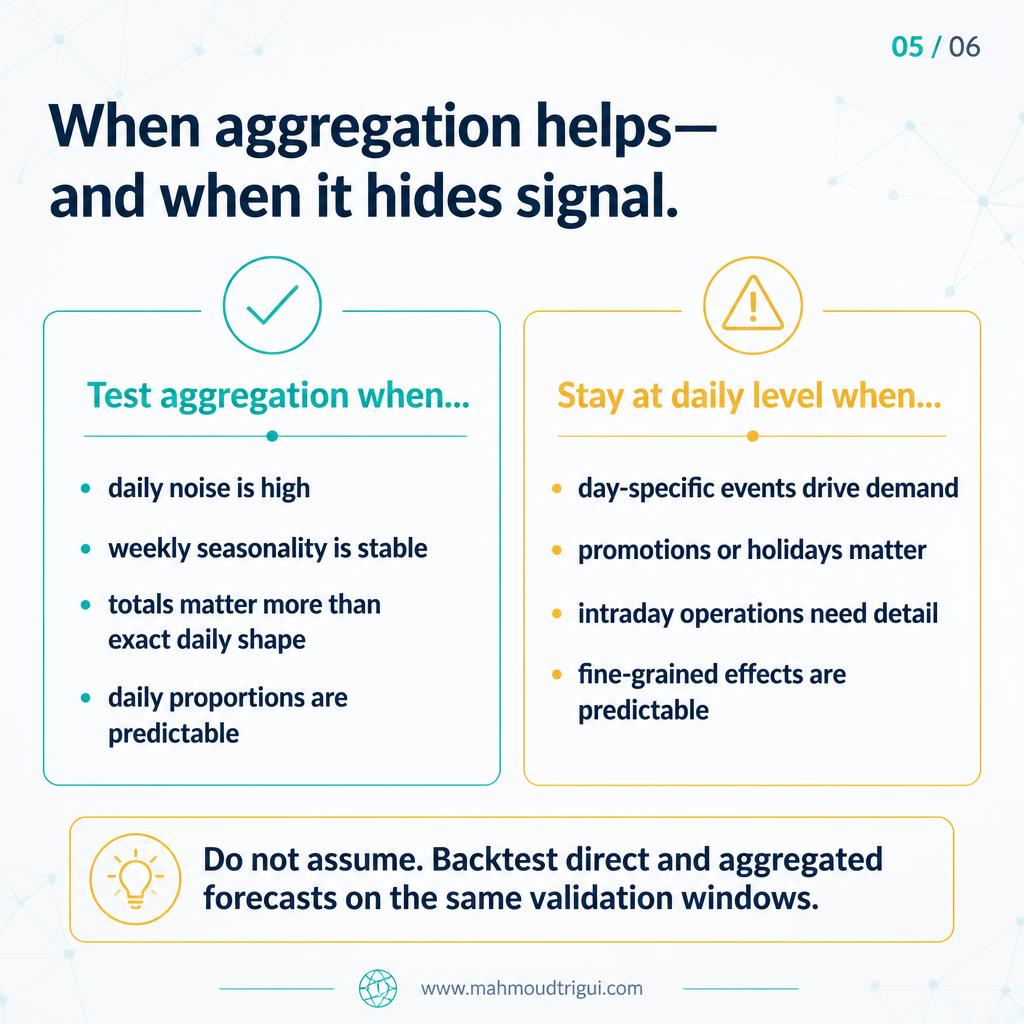
Aggregation is not automatically a win. It helps most when the fine-grained pattern is mostly unpredictable noise and a higher level shows a stable trend or weekly rhythm. If Monday is reliably different from Friday, the daily structure still matters — which is why the pattern ends with a careful return to the operational level.
The Approach
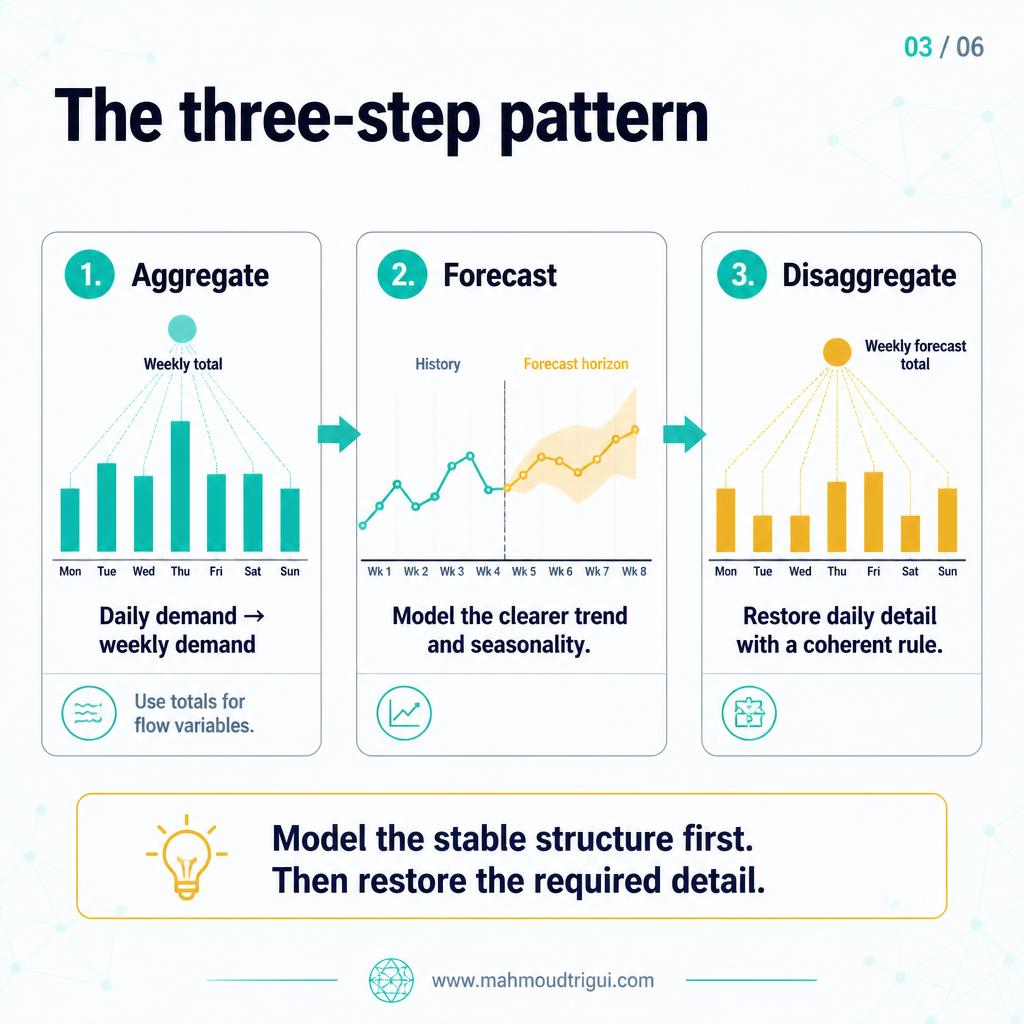
The pattern is Aggregate → Forecast → Disaggregate. Raise the forecasting level to the stable signal, model it there, then restore the detail the operation needs.
1. Aggregate
Combine the fine-grained series to a level where the signal is clearer — daily demand to weekly demand, hourly volume to daily volume, 15-minute usage to hourly usage. Use totals for flow variables. Random day-to-day variation cancels out, and trend and seasonality become easier to identify.
2. Forecast
Model the stronger trend and seasonality at that higher level. The model focuses on the decision-relevant signal instead of chasing every local spike.
3. Disaggregate
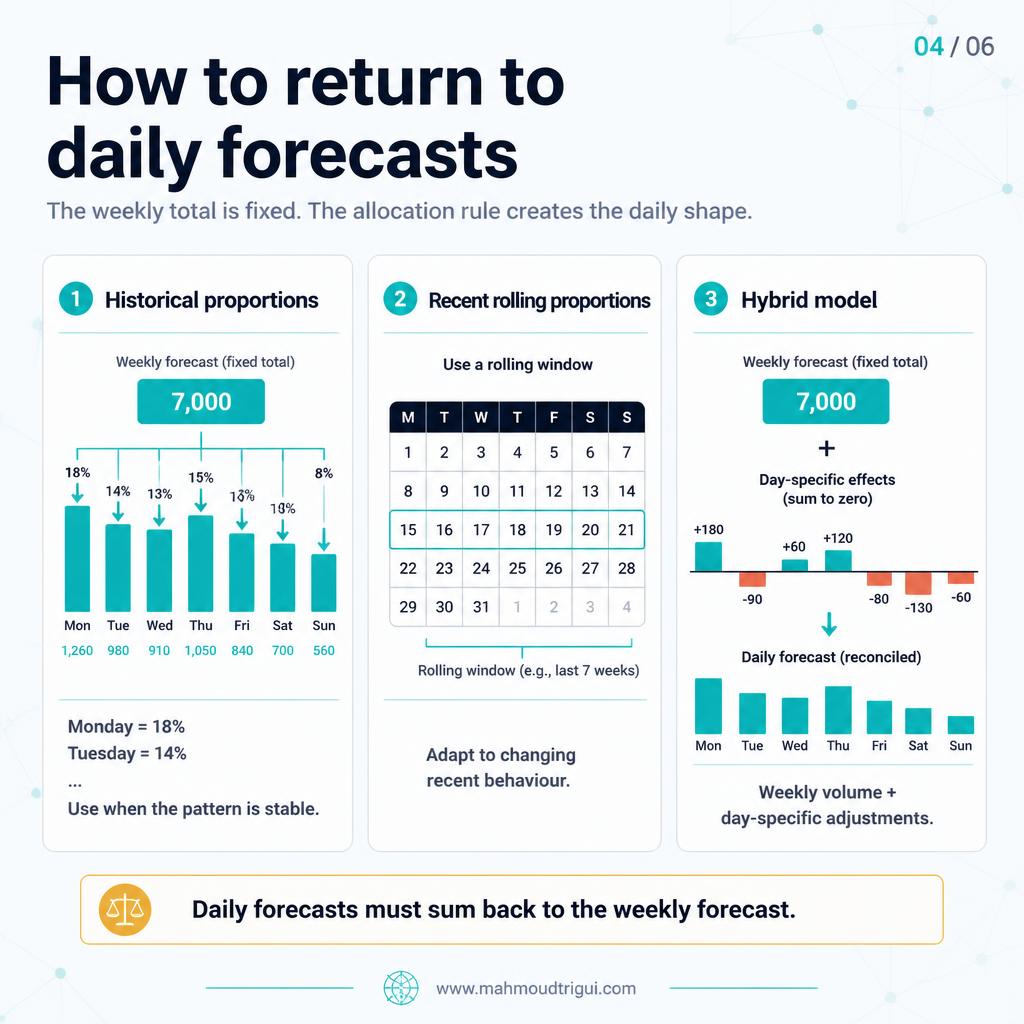
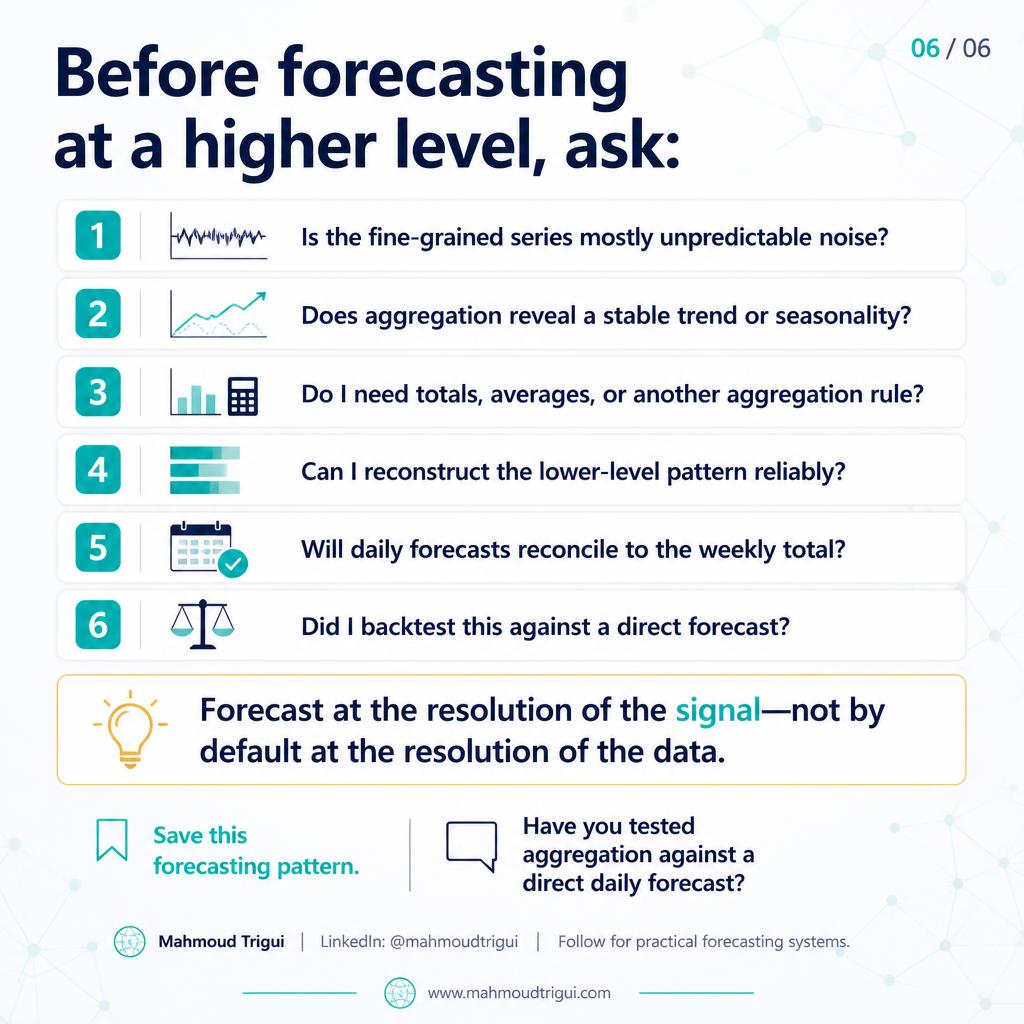
Return the forecast to the operational resolution with a coherent rule: historical day-of-week proportions, recent rolling proportions, or a hybrid of weekly volume plus a day-specific effects component. One hard constraint — daily forecasts must add back up to the weekly forecast, or your plans become inconsistent across reporting levels.
I use this approach when daily noise is high, the weekly rhythm is stable, and the operational decision still needs daily numbers. I avoid it when daily events, promotions, holidays, or day-specific behaviour are the real signal — and I backtest the aggregated forecast against the direct daily forecast on the same validation windows before adopting it.
Outcome
The lesson is bigger than the technique: do not forecast at the resolution of the data by default — forecast at the resolution of the signal. A weekly total with a good allocation rule often beats a daily model that overreacts to noise, and it keeps the two reporting levels consistent. The wrong level hides signal; the right level makes it visible.
Key Takeaway
Design insight: If daily data is noisy, forcing a forecast model to explain every local spike chases noise instead of signal. Aggregate the series to a level where trend and seasonality are easier to see — daily demand to weekly, hourly to daily — forecast the higher level, then reconcile the forecast back to the operational resolution with a consistent rule such as historical or rolling proportions. Daily values must sum back to the weekly total. Forecast at the resolution of the signal, not by default at the resolution of the data — and backtest aggregation against the direct forecast on the same validation windows.
FAQ
What is the key takeaway from "Aggregate → Forecast → Disaggregate"?
If daily data is noisy, forcing a forecast model to explain every local spike chases noise instead of signal. Aggregate the series to a level where trend and seasonality are easier to see — daily demand to weekly, hourly to daily — forecast the higher level, then reconcile the forecast back to the operational resolution with a consistent rule such as historical or rolling proportions. Daily values must sum back to the weekly total. Forecast at the resolution of the signal, not by default at the resolution of the data — and backtest aggregation against the direct forecast on the same validation windows.
Who wrote this and what is it about?
This was written by Mahmoud Trigui, Senior Data Scientist. If daily data is noisy, forecast the stable weekly signal, then disaggregate back to daily. Model at the resolution of the signal.