Telecom Customer Segmentation
The hardest segmentation decision was not the clustering method — it was defining what one row should represent, making the variables clusterable, iterating until clusters became operationally meaningful, and bridging unsupervised discovery to a production-ready supervised assignment system.
TL;DR: In distance-based unsupervised learning, bad variable shape is a bigger problem than variable redundancy. And the question "which clustering method?" must come after "are all these variables even representable in a shared distance space?"
Architecture
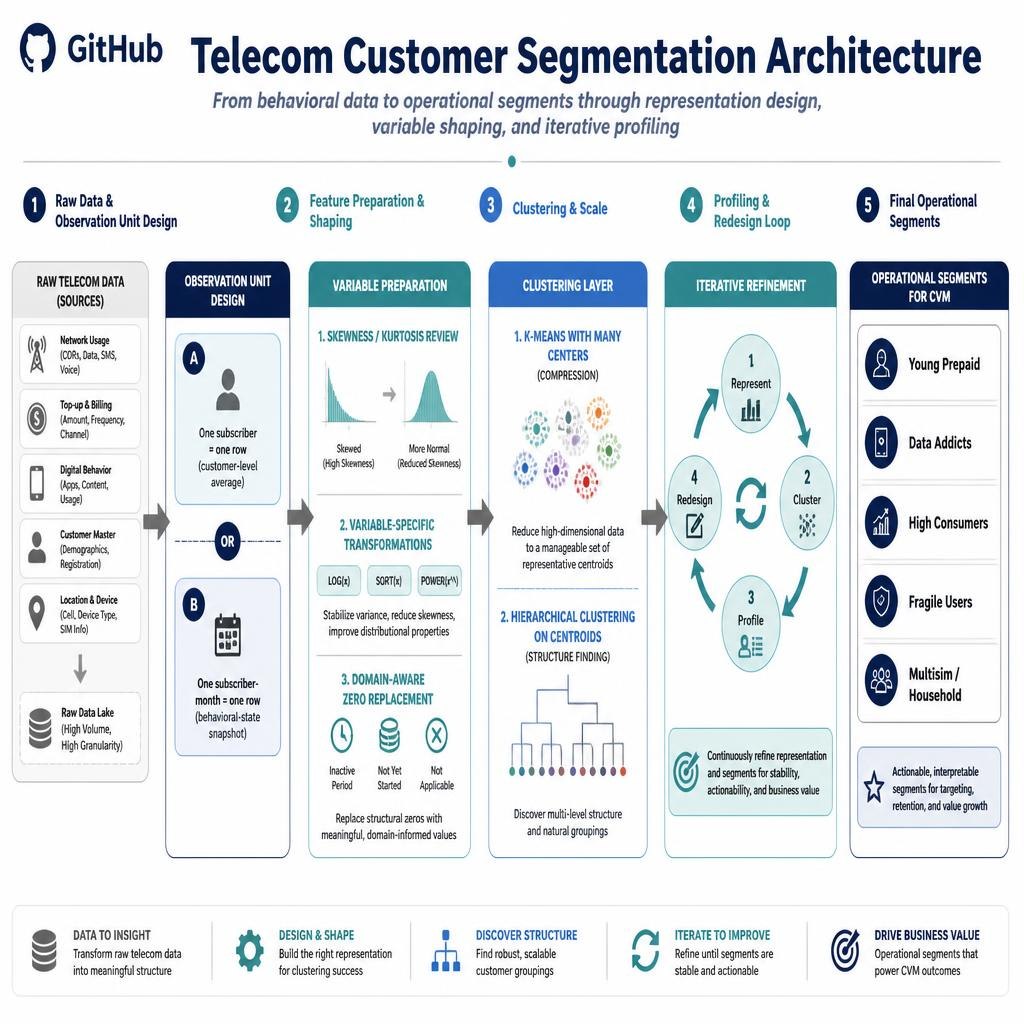
Overview
Built a full customer segmentation system for CVM (Customer Value Management) operations at Tunisia Telecom. Two phases: unsupervised clustering to discover behavioral segments, then supervised classification to assign new and existing customers using interpretable business rules.
The main challenge was not the algorithm. It was a sequence of design decisions: what should one row represent, are the variables even compatible with distance-based clustering, and how do you bridge the output of an unsupervised model to a system that can score new subscribers every month without re-running the pipeline.
The Four Core Design Problems
1. Observation Unit Design: Customers vs. Behavioral States
With monthly behavioral history per subscriber, the first question was: does one row represent a customer (collapsed over time) or a behavioral state (one row per subscriber-month)? Approach A produces stable long-term customer typologies — useful for structural CVM strategy. Approach B reveals behavioral transitions — useful for early warning signals and lifecycle modeling. The choice was made based on the specific CVM use case, not on what was computationally easier.
/* Approach A: one subscriber = one row */
select subscriber_id,
       sum(recharge_amount) / history_months  as avg_recharge_amount,
       sum(recharge_count)  / history_months  as avg_recharge_count,
       case when sum(recharge_count) > 0
            then sum(recharge_amount) / sum(recharge_count)
            else 0 end                         as avg_recharge_value,
       sum(recharge_days)   / total_days       as recharge_frequency
from subscriber_recharge_monthly
group by subscriber_id;
2. Variable Clusterability Before Redundancy Removal
The raw feature space had extreme skewness — some variables with skewness above 40, kurtosis above 1000. Standard scaling alone would make the distance geometry unstable. Before any correlation-based feature removal, every variable was tested for clusterability and assigned a transformation: log (moderate skew), sqrt (light skew), power ^0.25 (heavy skew), or exp (compressed). Variables that could not be stabilized by any transformation were removed — not because they were redundant, but because they were unusable in a distance space.
/* Variable-specific transformation assignments */
recharge_amount:      power_transform → (max(value,0) / scale) ^ 0.25
avg_call_duration:    log_transform   → log(max(value,0) / scale + 1)
active_days_ratio:    sqrt_transform  → sqrt(max(value,0) / scale)
total_data_volume:    power_transform → (max(value,0) / scale) ^ 0.25

/* Pipeline summary */
/* Input:    174 candidate variables                    */
/* Retained:  49 variables (transformable + stable)    */
/* Rejected:  49 variables (no transform stabilized)   */
3. K-means Compression Before Hierarchical Clustering
With hundreds of thousands of subscribers, hierarchical clustering cannot run directly (quadratic complexity). But K-means alone flattens nested structure. The solution: use K-means as a compression layer first (compressing to ~1000 representative centroids), then run Ward's hierarchical method on those centroids. K-means acts as a reducer, not the final segmenter — and the dendrogram reveals the natural cluster count.
/* Stage 1: K-means compression */
proc fastclus data=normalized_features
    maxclusters=1000
    out=compressed_centroids;
  var feature_1 - feature_49;
run;

/* Stage 2: Hierarchical clustering on centroids */
proc cluster data=compressed_centroids
    method=ward
    outtree=dendrogram;
  var feature_1 - feature_49;
run;

/* Cut dendrogram at chosen depth */
proc tree data=dendrogram nclusters=8
    out=final_segments;
run;
4. Supervised Rule-Based Assignment for Production
A subscriber who activated last month has only 1–2 months of history. The unsupervised model was built on a longer behavioral window — it cannot score new customers. The supervised phase bridges this gap: use existing cluster memberships as a target label, augment across multiple months, train a decision tree, extract rules, round thresholds with CVM teams, and deploy as a monthly scoring system. The model that assigns is not the model that discovered.
/* Business-adjusted assignment rule (example) */
/* Raw tree split: data_revenue_ratio > 0.734 ... */
/* Business rule: */
if data_revenue_ratio >
    and data_pack_frequency >
    and voice_duration_share <
    then assign → "Data Intensive"
/* Note: original cluster ~100K, rule-based segment ~90-110K */
/* Goal: stability and interpretability, not exact replication */
Iterative Profiling Dimensions
Each clustering iteration was profiled across all of the following dimensions. Segments that could not be described in business terms across most dimensions were discarded and the variable set was revised:
- Recharge behavior: frequency, regularity, weekend patterns, top-up value distribution
- Voice vs. data mix: usage intensity by service, on-net vs. off-net split
- Handset quality: 2G/3G/4G device capability, device change frequency
- Network community: graph degree, community size, operator mix in social group
- Region and mobility: geographic footprint, distinct cell towers visited
- CVM response: campaign sensitivity, offer activation behavior
- Churn signals: inactivity days, declining usage trends, recharge evaporation
Key Takeaway
Useful segments did not emerge from running one clustering method once. The final segmentation came from repeated cycles of representation, clustering, profiling, and redesign. Unlike supervised learning, there is no target variable to tell you whether the representation is right — iteration is not optional, it is the method.
Design insight: In distance-based unsupervised learning, bad variable shape is a bigger problem than variable redundancy. And the question "which clustering method?" must come after "are all these variables even representable in a shared distance space?"
FAQ
What is the key takeaway from "Telecom Customer Segmentation"?
In distance-based unsupervised learning, bad variable shape is a bigger problem than variable redundancy. And the question "which clustering method?" must come after "are all these variables even representable in a shared distance space?"
Who wrote this and what is it about?
This was written by Mahmoud Trigui, Senior Data Scientist. Full customer segmentation system for CVM operations at Tunisia Telecom. Variable clusterability testing, transformation assignment (log, sqrt, power 0.25), K-means compression to 1000 centroids, Ward hierarchical clustering, dendrogram cut, supervised decision tree rule extraction for monthly production scoring. SAS, R. 174 candidate variables, 49 retained.