5 Forecasting Habits R Taught Me
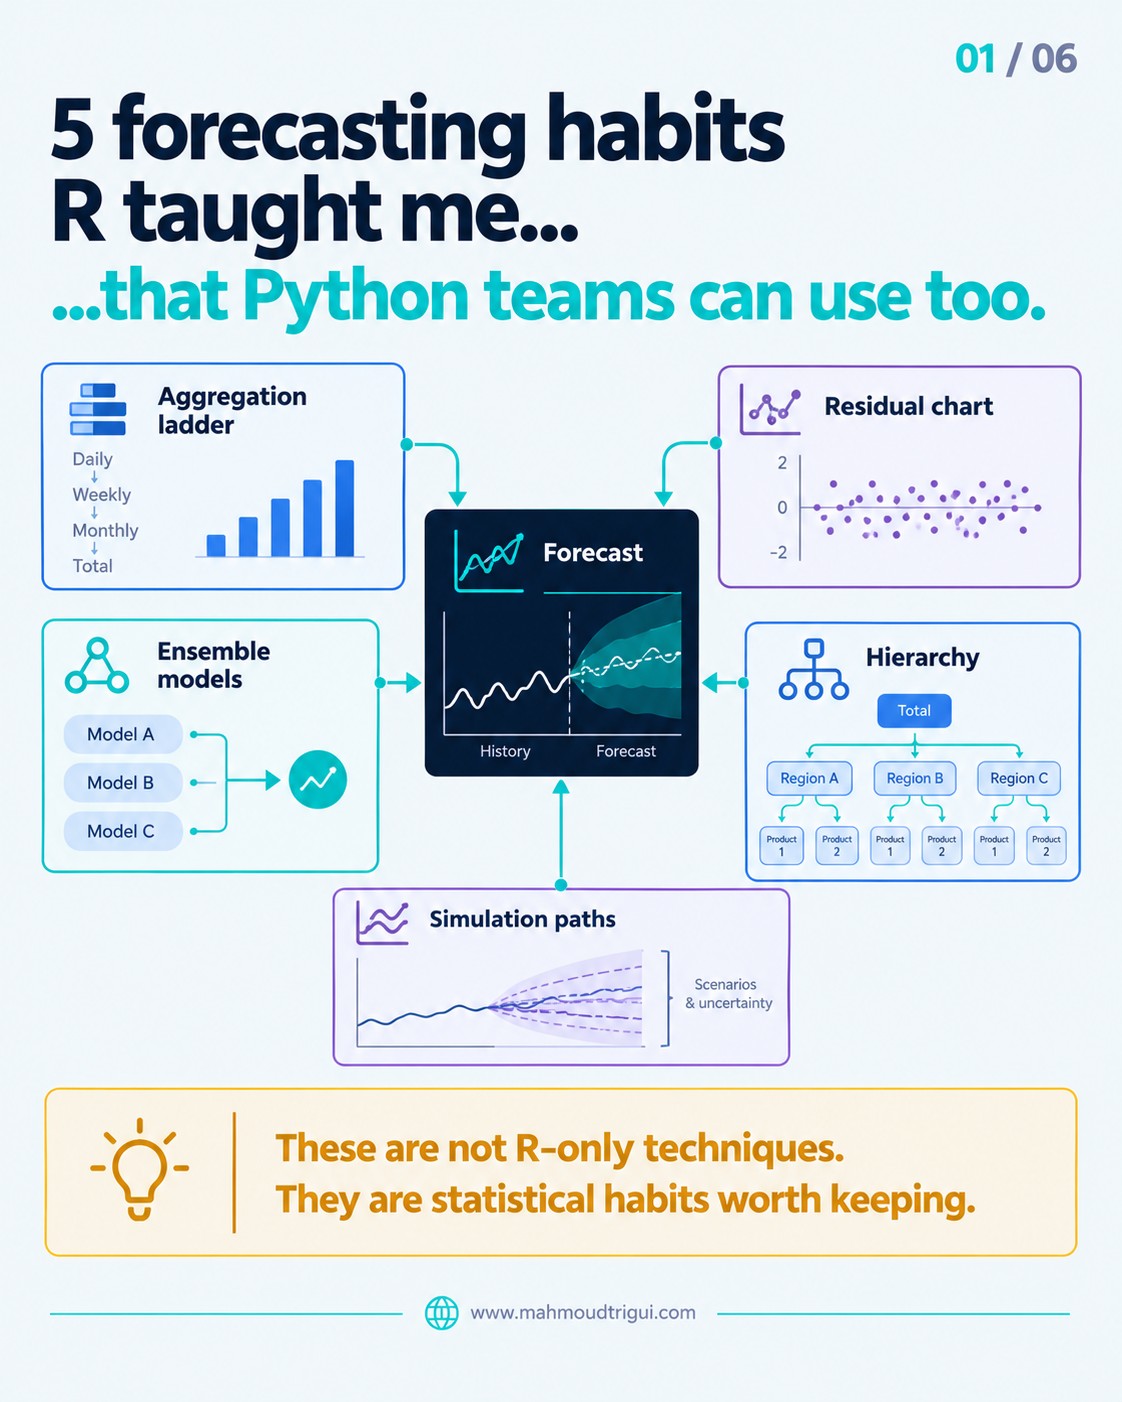
Working with R taught me forecasting habits I still bring into Python workflows — not because Python cannot do them, but because R's ecosystem makes the statistical thinking harder to ignore.
TL;DR: Different tool ecosystems teach different habits, but the habits are what transfer — not the syntax. R did not make me a better forecaster because of the language itself; it made residual checks, uncertainty, and statistical structure harder to ignore. Before trusting a forecast in any stack, ask five questions: should this series be modelled at a coarser level, what structure is left in the residuals, are these models genuinely complementary, can sparse groups borrow strength from related ones, and does the decision change once the plausible range widens?
Visual Summary
The Problem
Most of my forecasting work now happens in Python. But the habits that shape how I model came from years of working in R, where the forecasting ecosystem makes statistical structure hard to avoid: decomposition, residual diagnostics, hierarchical series, reconciliation, and uncertainty.
That is not an argument about languages. Python can do every one of these things. The risk in a Python workflow is not missing libraries — it is skipping the questions that R's defaults quietly force you to answer before a forecast looks trustworthy.
The Approach
The patterns below are not R-only techniques. They are statistical habits worth keeping, and they transfer to any stack — statsmodels, MLforecast, scikit-learn, or a warehouse SQL layer.
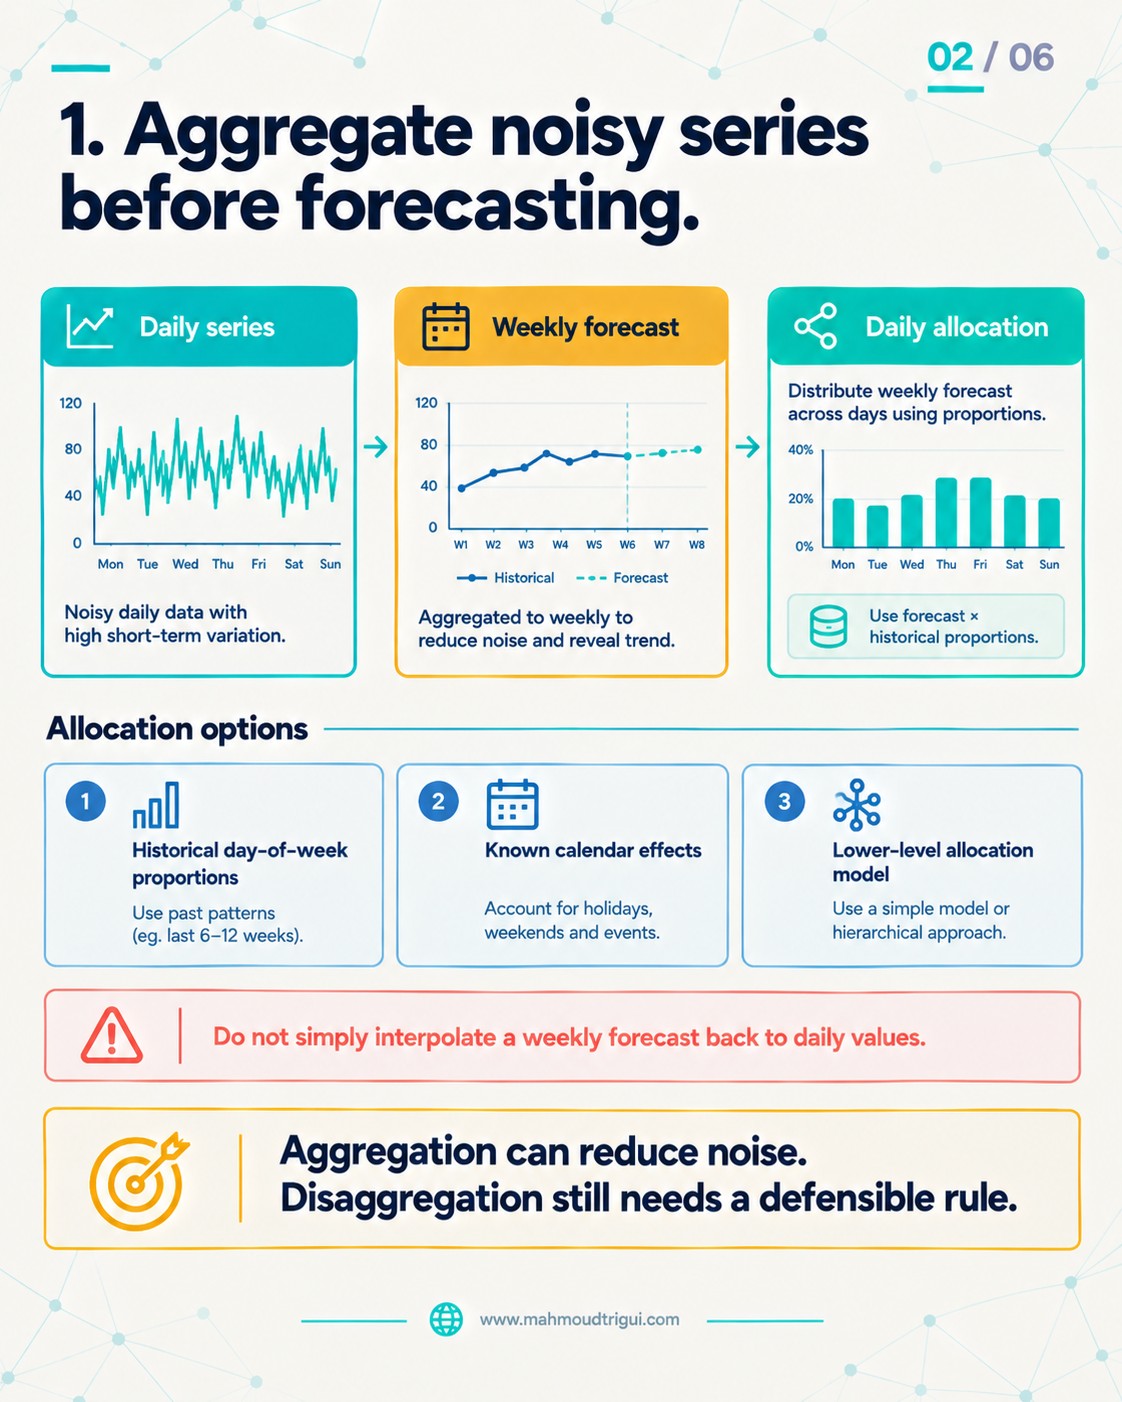
1. Aggregate, forecast, then disaggregate carefully
High-frequency series can be noisy. In some cases, forecasting at a more stable weekly or monthly level is more reliable than forecasting daily data directly. But the disaggregation step needs a valid allocation rule — day-of-week proportions, known calendar effects, or a separate lower-level model. Never simply interpolate a weekly forecast back to daily values.
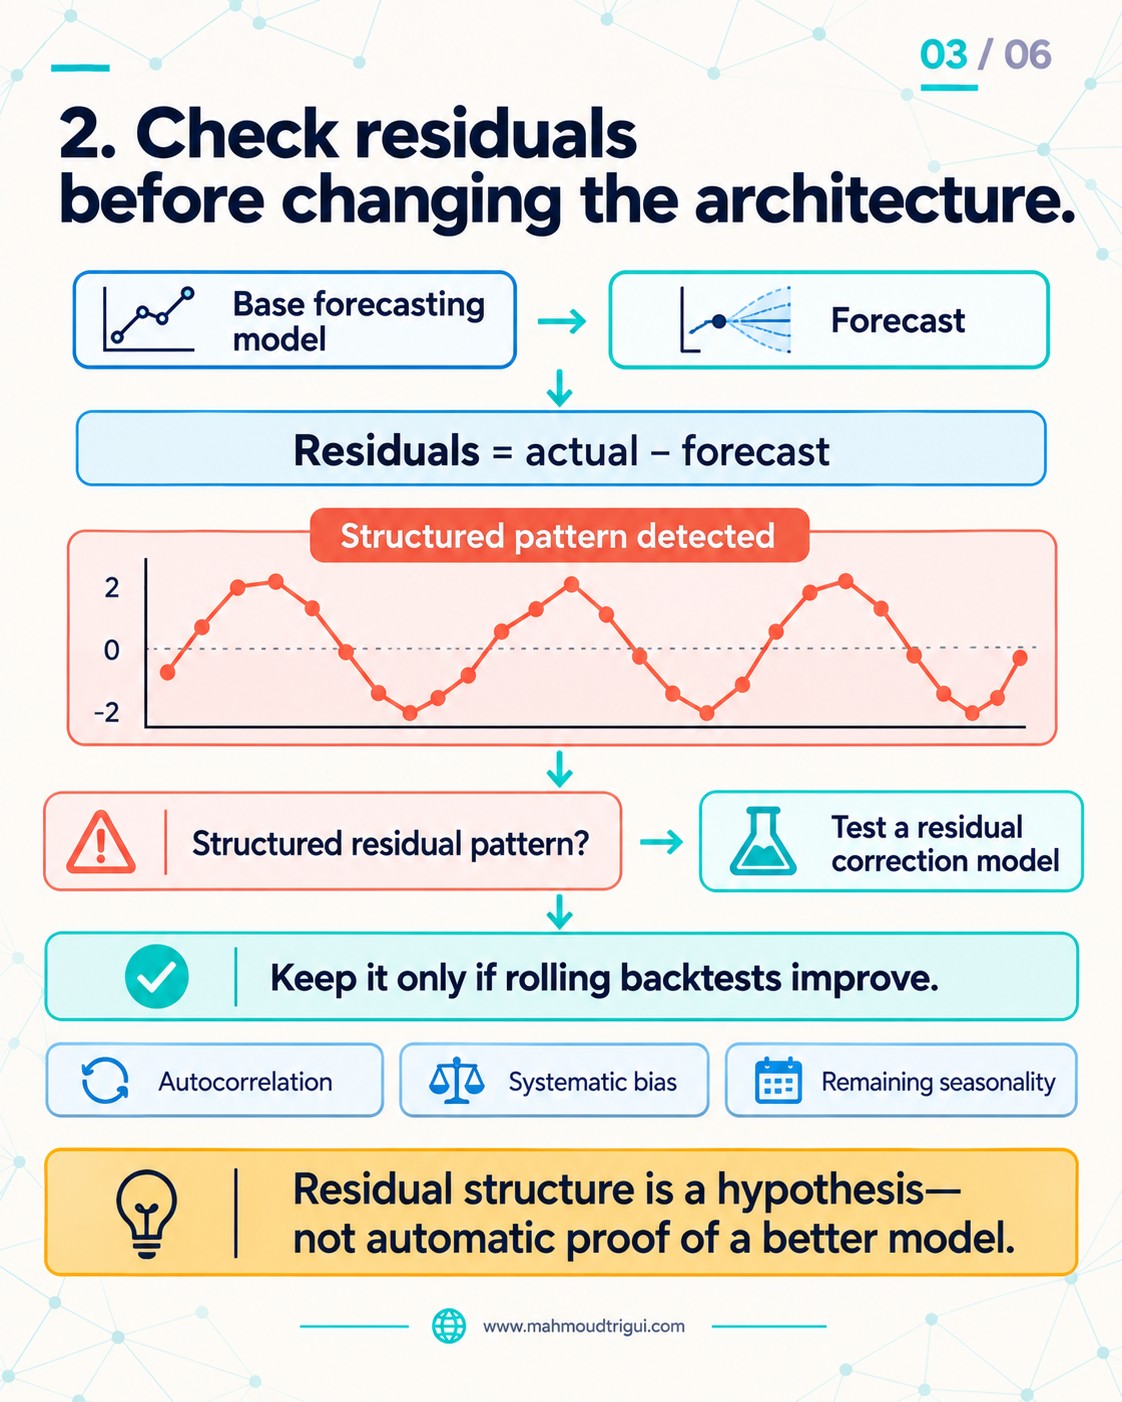
2. Inspect residuals before changing the architecture
If residuals contain autocorrelation, seasonality, or systematic bias, the first model may have left usable structure behind. A residual model can help — but only if rolling backtests show a stable improvement. Residual structure is a hypothesis, not automatic proof that a more complex model will win.
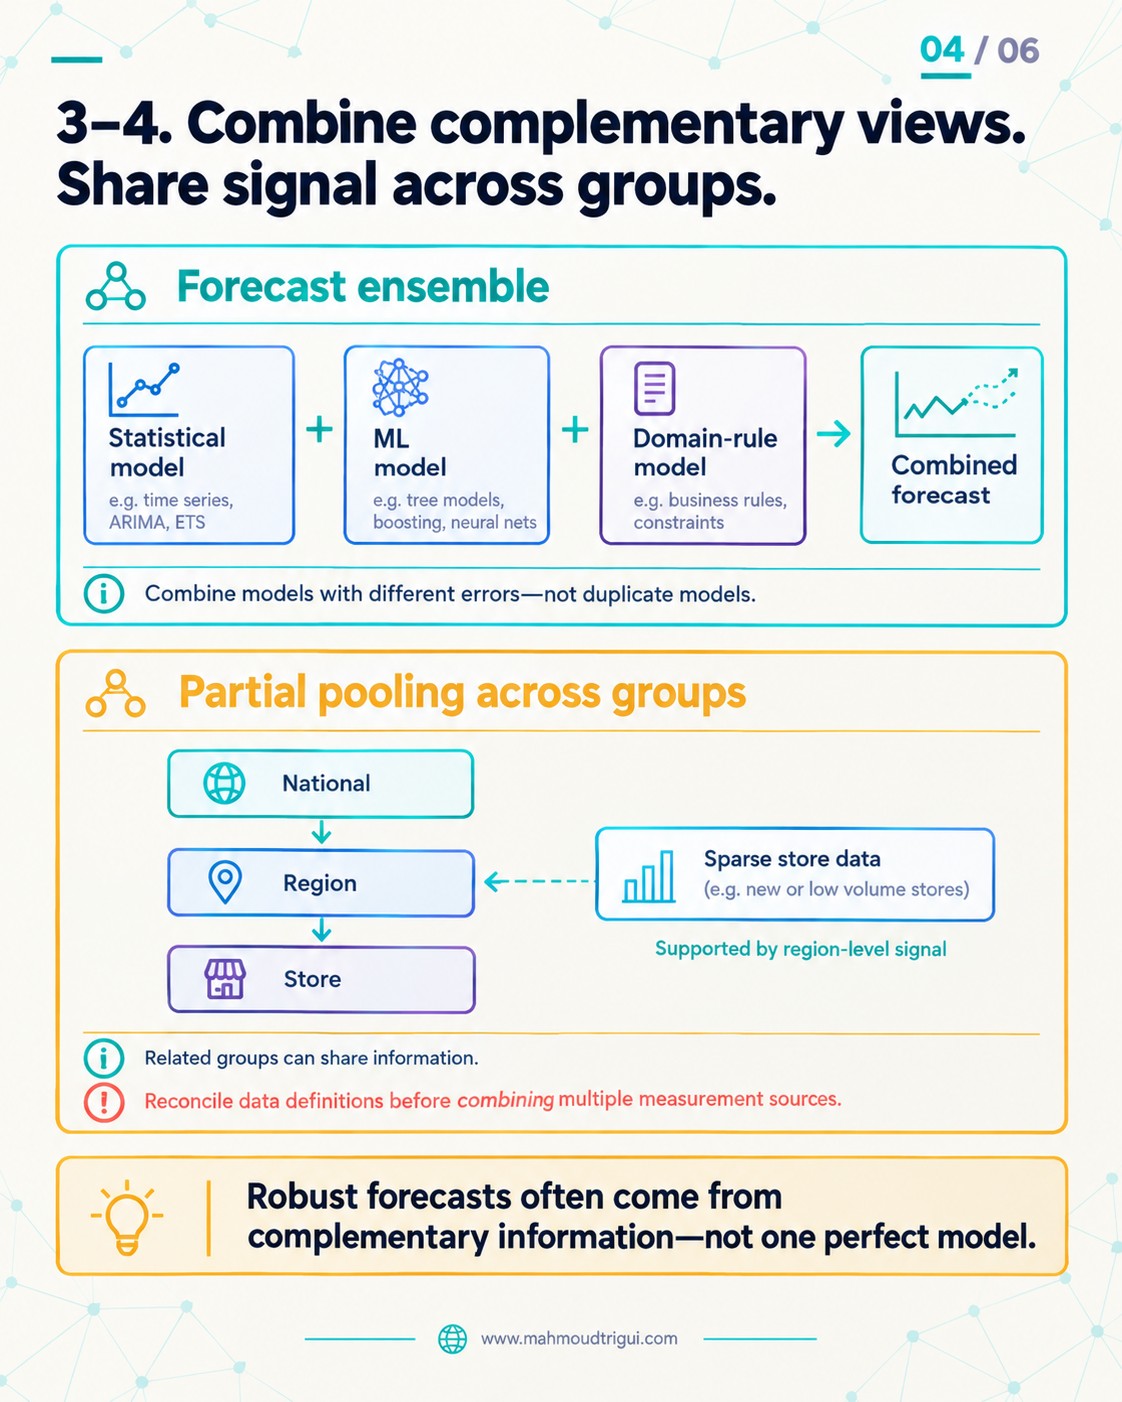
3. Combine complementary forecasts
Ensembles can improve robustness when models use genuinely different signals or assumptions. Combine models with different errors, not duplicate versions of the same model. And before combining anything, make sure the underlying data sources and business definitions are comparable.
4. Share information across related groups
Stores, regions, products, and customer segments often have too little history individually. Hierarchical or mixed-effects approaches enable partial pooling: stable groups keep their own signal while sparse groups borrow strength from the wider population.
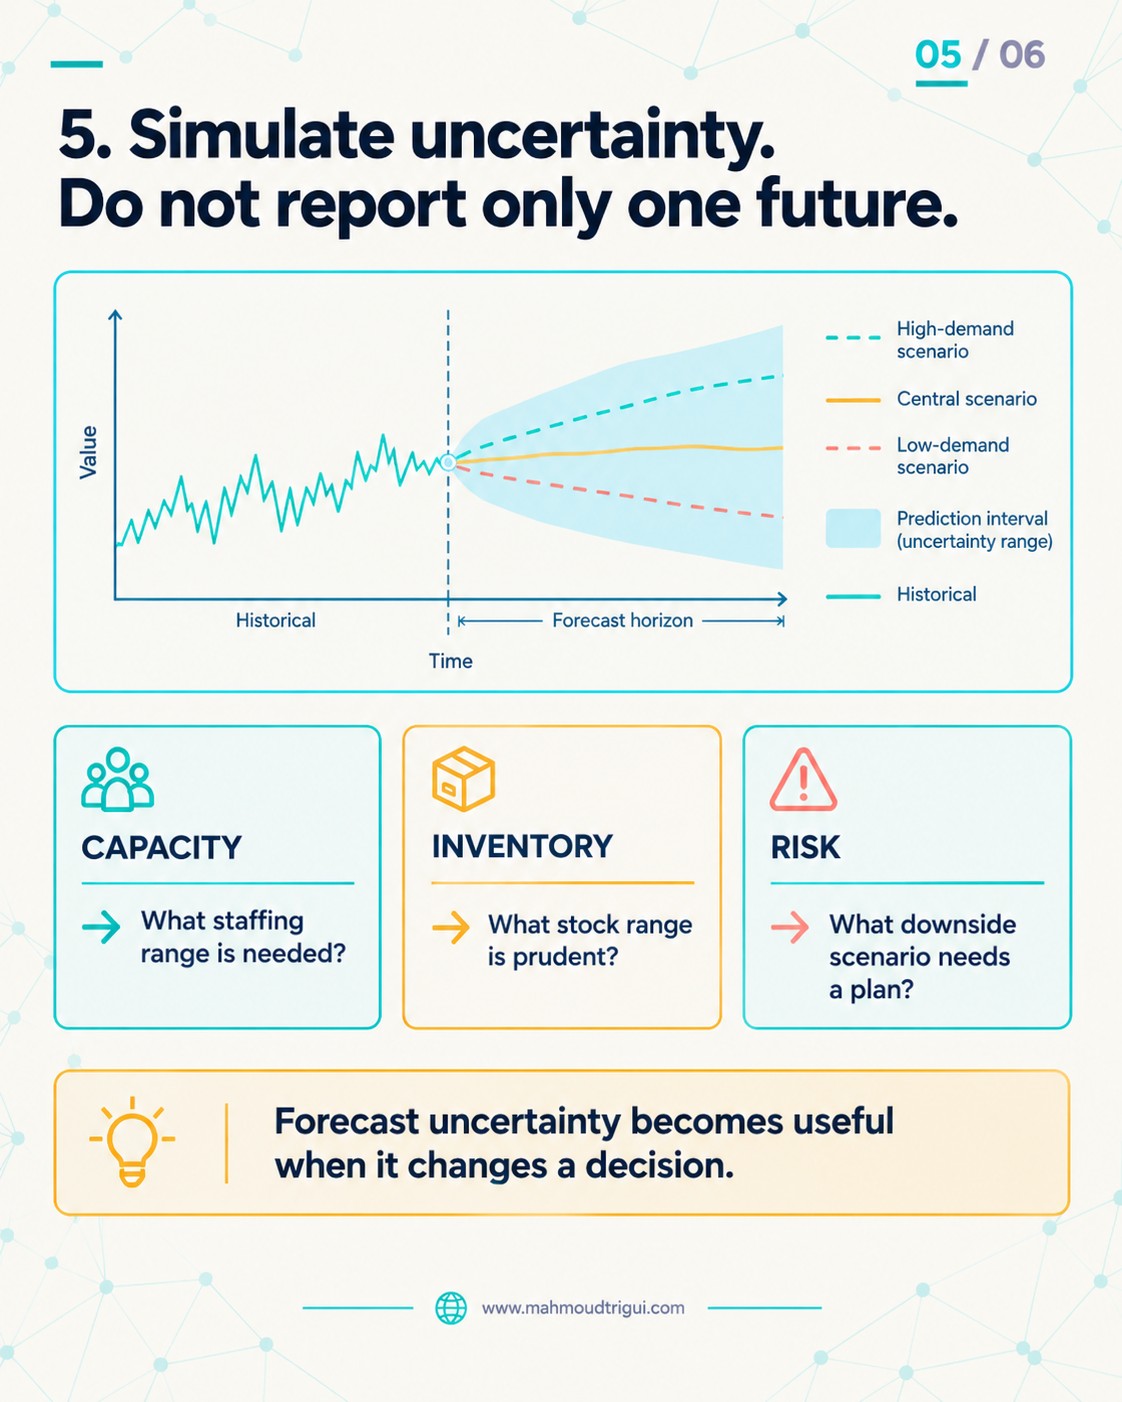
5. Simulate uncertainty, not only point forecasts
Decision-makers usually need plausible ranges and scenarios, not only one central estimate. Simulation turns uncertainty into operational questions: what happens if demand is lower, higher, or more volatile than expected — and what would we do differently in each case?
Outcome
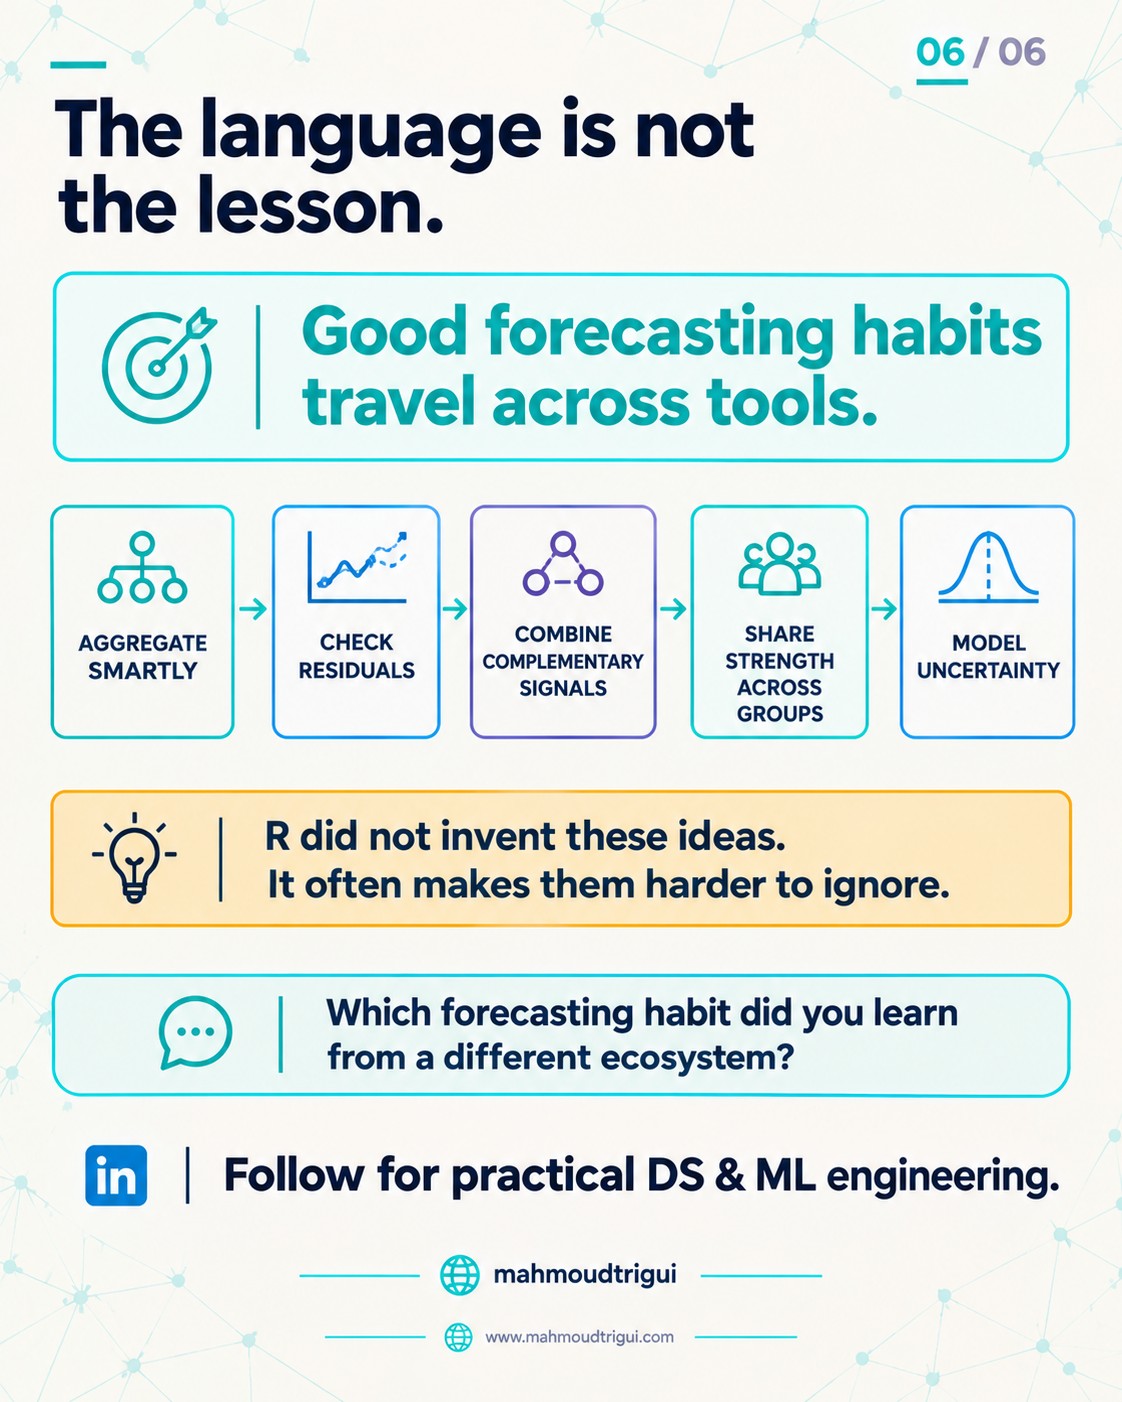
The wider lesson is simple: different tool ecosystems teach different habits. R did not make me a better forecaster because of the language itself. It made residual checks, uncertainty, and statistical structure harder to ignore — and those habits survived every migration since.
Carrying them into Python did not mean reimplementing R. It meant keeping the checklist: is this series better modelled at a coarser level, what is left in the residuals, are these models actually complementary, can sparse groups borrow strength, and does the decision change when the range widens?
Key Takeaway
Design insight: Different tool ecosystems teach different habits, but the habits are what transfer — not the syntax. R did not make me a better forecaster because of the language itself; it made residual checks, uncertainty, and statistical structure harder to ignore. Before trusting a forecast in any stack, ask five questions: should this series be modelled at a coarser level, what structure is left in the residuals, are these models genuinely complementary, can sparse groups borrow strength from related ones, and does the decision change once the plausible range widens?
Related
R Forecasting at Scale: 200 Series, 4 Baselines → Aggregate → Forecast → Disaggregate → Turning Decomposition Into a Forecasting Strategy → Why Two Weaker Models Beat a Stronger One Through Error Diversity → Time-Series Cross-Validation: Train Past, Validate Future → Conformal Prediction: When the Model Is Uncertain → The Hardest Forecasting Decision Is Which Model to Use → Regime-Aware Forecasting: Route Each Series by Its State → MLforecast Forecasting Pipeline → StatsForecast, MLForecast, NeuralForecast: One Ecosystem →FAQ
What is the key takeaway from "5 Forecasting Habits R Taught Me"?
Different tool ecosystems teach different habits, but the habits are what transfer — not the syntax. R did not make me a better forecaster because of the language itself; it made residual checks, uncertainty, and statistical structure harder to ignore. Before trusting a forecast in any stack, ask five questions: should this series be modelled at a coarser level, what structure is left in the residuals, are these models genuinely complementary, can sparse groups borrow strength from related ones, and does the decision change once the plausible range widens?
Who wrote this and what is it about?
This was written by Mahmoud Trigui, Senior Data Scientist. Five forecasting habits from R that work in Python too: aggregate smartly, check residuals, combine complementary models, pool signal, simulate uncertainty.