Model the Context, Not Just the Curve
In 2020 I placed 4th of 884 in a COVID-19 forecasting challenge by treating context as a first-class feature set — not only the curves every team could see.
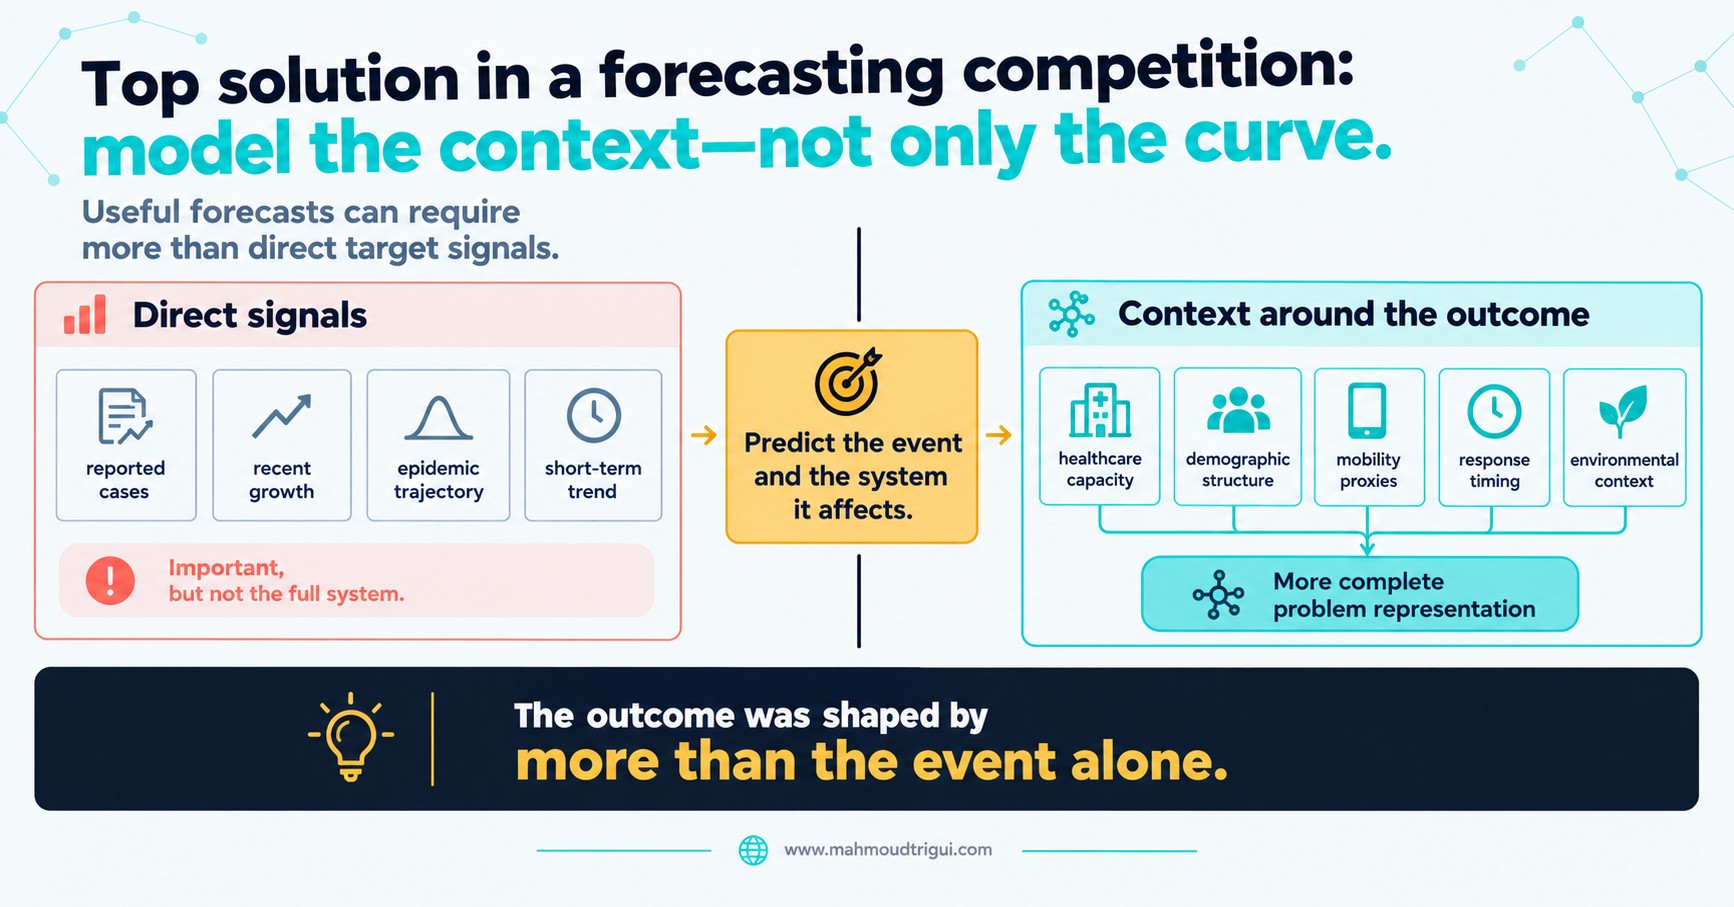
TL;DR: Before adding another transformation of the target, describe the system the target lives in. Capacity, vulnerability, mobility, policy timing and data quality explain why identical curves diverge across places. These features rarely look impressive in isolation, but they change what the model can represent — and that is why feature engineering is not creating more columns, but choosing a better representation of the real-world system.
The Problem
In April 2020 I joined a Zindi challenge forecasting COVID-19 death outcomes. The obvious feature set was also the most crowded one: reported cases, recent growth rates, epidemic trajectories and short-term trend patterns. Those signals matter, and almost every team was looking at them.
The problem was that similar-looking curves produced very different outcomes in different places. Two countries could report the same case growth and still diverge on deaths, because exposure, vulnerability, reporting practice, healthcare access, policy timing and data quality all shaped what got observed. If the model only saw the curve, it had no way to represent any of that.
The Approach
I kept the epidemiological signals and added a second angle: what kind of system is this event happening to? I was not trying to replace the trajectory features — I was trying to describe the conditions in which those trajectories occurred. I grouped the extra variables into five families and tested each one as a complement, not a substitute.
Healthcare capacity
Hospital beds, intensive-care availability and staffing per capita. A system close to its capacity can turn the same case load into a very different outcome, so capacity belongs in the representation.
Demographic structure
Age distribution and household composition. These describe who is exposed and how vulnerable the population is, independent of how many cases are reported this week.
Population density and mobility proxies
Density, urbanisation and available movement or activity proxies. They capture how easily contact spreads — context that a national case count averages away.
Timing of public-health measures
When restrictions started and eased relative to local growth, not just whether they existed. Two locations with the same policy can be at completely different points in the response curve.
Environmental and geographic context
Climate, altitude, region and connectivity. I treated these as structural controls rather than causal claims — they help separate places that differ for reasons unrelated to the epidemic curve.
The discipline mattered as much as the feature list. Every context variable had to be known at the forecast origin — no future policy dates, no revised population figures, no after-the-fact reporting corrections. I also checked that the new columns were not quietly re-encoding the target, and validated on held-out countries and later weeks so the model was judged on places and periods it had not seen.
Outcome
The submission placed 4th among 884 registered entrants; only 47 teams submitted. The rank was satisfying, but the durable result was methodological. The features that helped most were not direct measurements of the target — they described capacity, constraints, behaviour and environment around it. Context made the problem representation more complete, and that changed which errors the model could avoid.
I documented the full competition build separately, including how the final pipeline routed countries by trajectory before forecasting. The two views are complementary: routing decides which model fits a series, context features decide what the model is allowed to know about the place it is forecasting. See COVID-19 Global Spread Prediction for the competition write-up.
Key Takeaway
Design insight: Before adding another transformation of the target, describe the system the target lives in. Capacity, vulnerability, mobility, policy timing and data quality explain why identical curves diverge across places. These features rarely look impressive in isolation, but they change what the model can represent — and that is why feature engineering is not creating more columns, but choosing a better representation of the real-world system.
Related
Better Features Beat More Model Shopping → A Domain Formula Is a Feature → Necessary Conditions vs Drivers → ISNULL() Is a Feature → Categorical Variables Need a Mechanism → 10K Clean Rows Can Beat 1M Noisy Rows → Label Validity in Time-Based ML → Target Leakage: Three Hidden Pitfalls → 5 Forecasting Habits R Taught Me → COVID-19 Global Spread Prediction →