Feature Engineering Is Assembling Evidence Across Systems
No single source tells the whole story. Combine partial views of the same behaviour — carefully, minimally, and with governance.
TL;DR: Feature engineering often means assembling partial evidence: combine usage, network, device and mobility signals into a stronger behavioural view, and interpret partial signals together rather than alone. The most valuable features are usually not found in one perfect table — they emerge when you combine partial views of the same real-world behaviour, carefully, minimally, and with appropriate governance. No single source is enough.
Visual Summary
The Problem
In a Multi-SIM analytics project, one of the hardest questions was not which model to use. It was what combination of signals could distinguish low activity from behaviour distributed across more than one SIM or operator.
A usage table alone could not answer that reliably. Low outgoing activity might indicate an inactive customer — or it might reflect activity happening elsewhere.
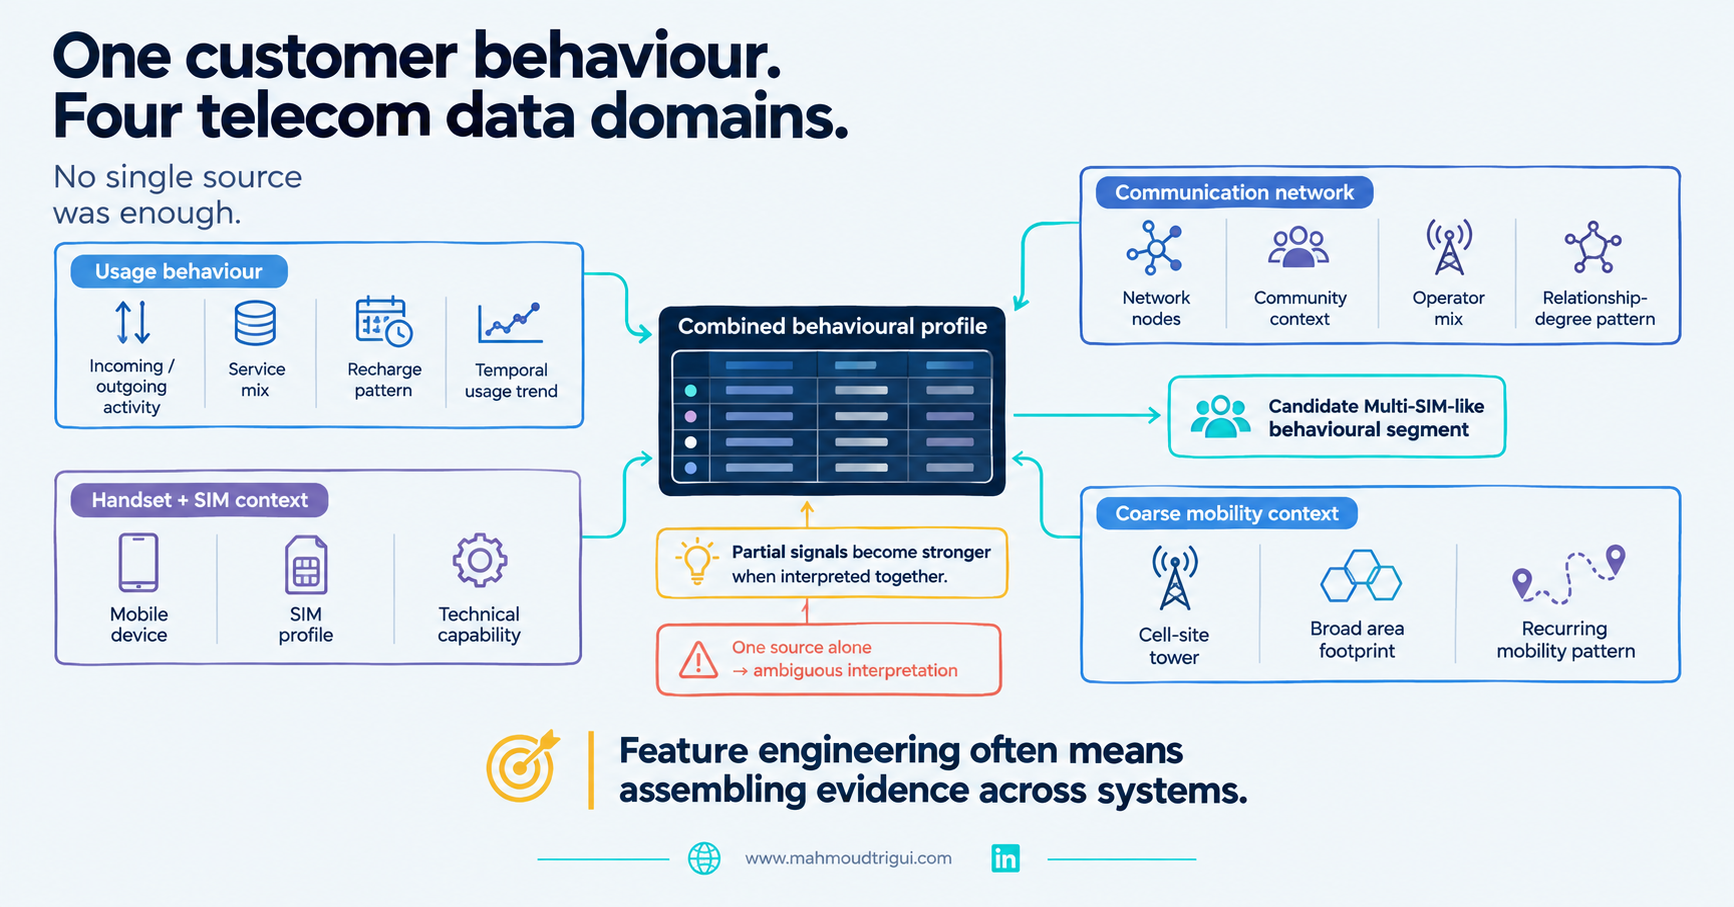
One source alone leads to an ambiguous interpretation. So several approved data domains were combined into one behavioural view.
The Approach
The most valuable features are often not found in one perfect table. They emerge when you combine partial views of the same real-world behaviour — carefully, minimally, and with appropriate governance.
Usage behaviour
Incoming and outgoing activity, operator-level traffic splits, recharge patterns, service mix, and temporal summaries.
Communication-network context
Community membership, operator mix inside the network, incoming and outgoing degree, and structural network role.
Handset and SIM context
Device category, SIM characteristics, and technical capability indicators.
Coarse location and mobility context
Aggregated cell-site footprint, urban or rural context, and recurring mobility patterns.
Each source added only part of the picture. A pattern became more meaningful when several signals aligned.
For example, low activity alone was ambiguous. But low activity combined with an operator-diverse communication network, relevant device context, and a consistent behavioural pattern could justify a stronger hypothesis for investigation.
Outcome
Feature engineering is often the work of assembling partial evidence from scattered systems. Partial signals become stronger when interpreted together.
Model choice mattered. But assembling reliable evidence across systems mattered just as much.
Key Takeaway
Design insight: Feature engineering often means assembling partial evidence: combine usage, network, device and mobility signals into a stronger behavioural view, and interpret partial signals together rather than alone. The most valuable features are usually not found in one perfect table — they emerge when you combine partial views of the same real-world behaviour, carefully, minimally, and with appropriate governance. No single source is enough.
Related
When the Label Does Not Exist: Define the Behaviour First →Turning a Categorical Variable Into Behavioral Signal →Cell Tower Dominance Is More Than a Demographic Feature →Households vs Communities: Different Detection Tasks →K-Means as Compression Before Hierarchical Clustering →Don't Ask Your Model to Learn What a Formula Knows →isnull() Is a Feature — Missingness as a Signal →Not Every Analytics Question Is About What Drives Outcome →
FAQ
What is the key takeaway from "Feature Engineering Is Assembling Evidence Across Systems"?
Feature engineering often means assembling partial evidence: combine usage, network, device and mobility signals into a stronger behavioural view, and interpret partial signals together rather than alone. The most valuable features are usually not found in one perfect table — they emerge when you combine partial views of the same real-world behaviour, carefully, minimally, and with appropriate governance. No single source is enough.
Who wrote this and what is it about?
This was written by Mahmoud Trigui, Senior Data Scientist. Feature engineering is assembling partial evidence: combine usage, network, device and mobility signals into one behavioural view. No single source is enough.