Conformal Prediction: Calibrated Forecast Intervals
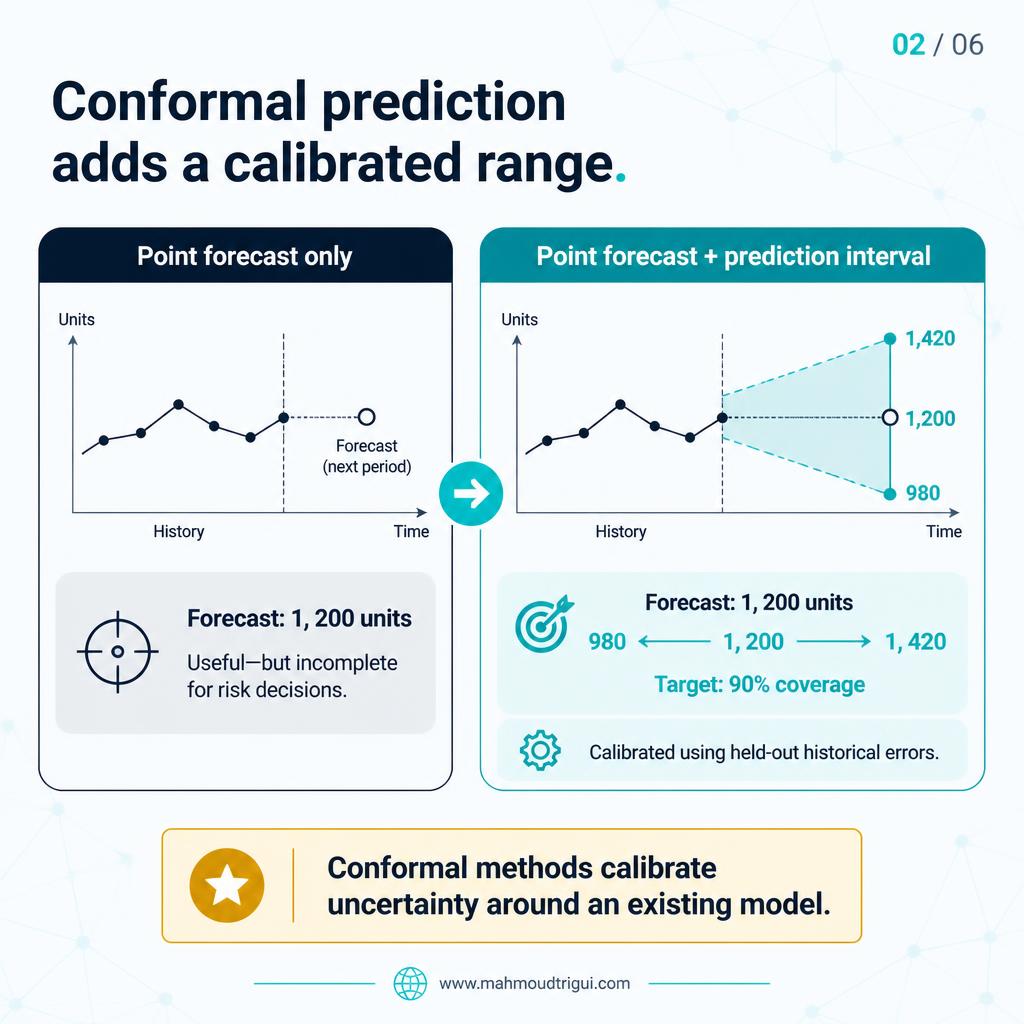
A point forecast tells you what the model expects. It does not tell you how much risk you are taking. Conformal prediction adds a calibrated range around that number, built from the errors the model actually made on data it never saw — so coverage can be measured instead of assumed.
TL;DR: A point forecast is not a plan. Split conformal prediction wraps any forecasting model in a prediction interval built from the errors it made on a held-out calibration set, so a 90% interval targets 90% long-run coverage — measured, not assumed. Basic split conformal gives every prediction the same width, so peak versus off-peak demand needs an adaptive method such as conformalized quantile regression. And no interval replaces evaluation: check coverage by horizon, segment, and future period before anyone plans capacity around it.
Visual Summary
The Problem
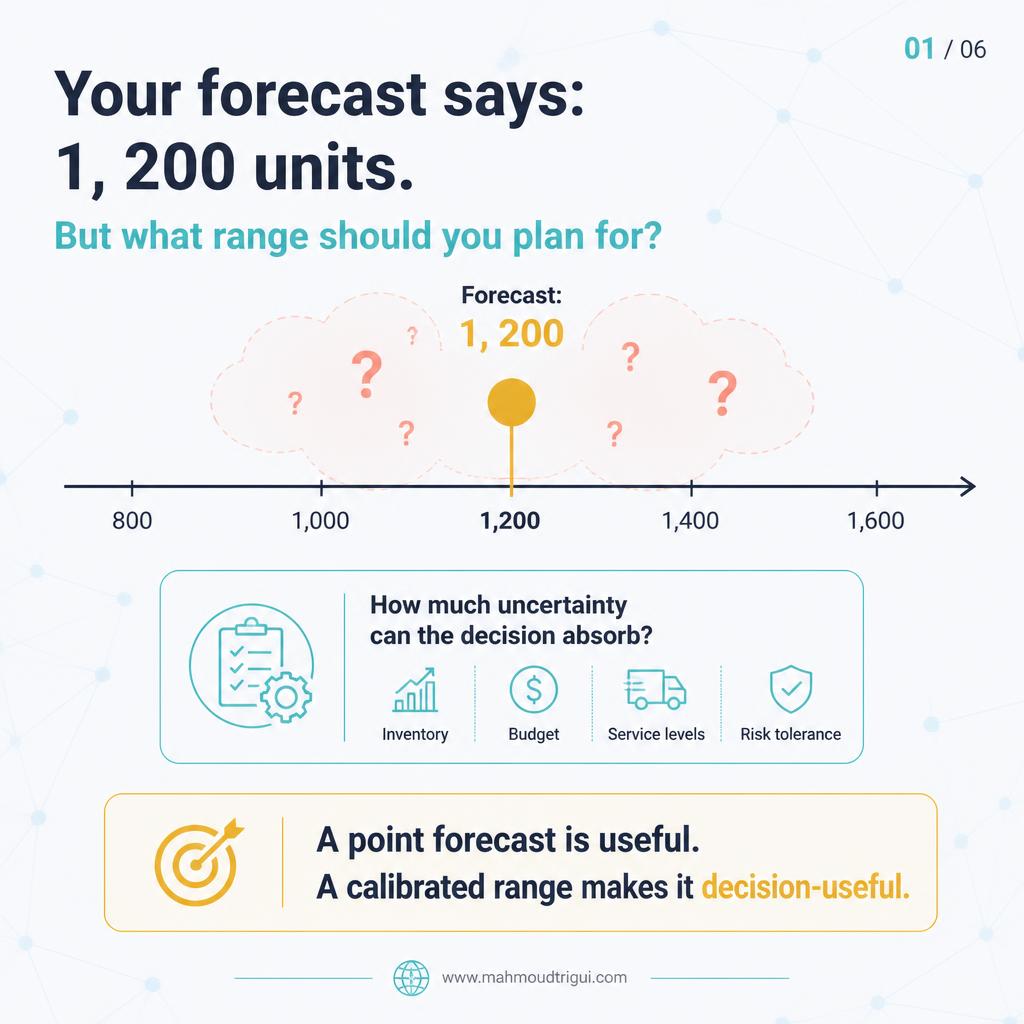
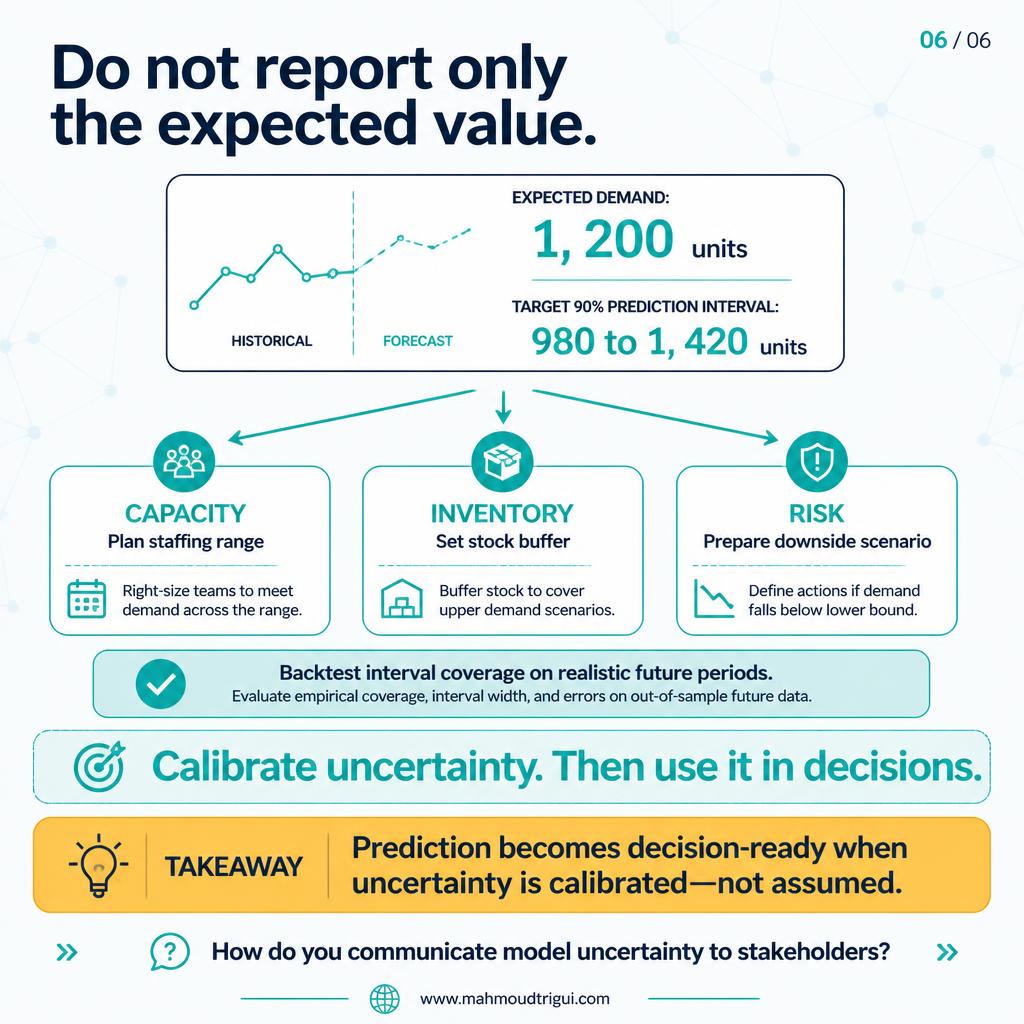
A point forecast is often reported as if it were a fact. The model says “Expected demand: 1,200 units”, and that single number moves into a plan, a purchase order, and a staffing roster. The operational question underneath it is different: what range should we plan for?
The usual fix is to assume an error distribution — normally distributed, a standard deviation, a backtested average error — and derive a range from it. That assumption is the weak point. It is rarely checked against the errors the model actually makes, and a single average error hides the fact that peak periods and quiet periods do not behave the same way.
The result is a number that looks precise and a plan that inherits every unexamined assumption behind it. When the miss lands, nobody can say whether the model was wrong or the range was never calibrated.
The Approach
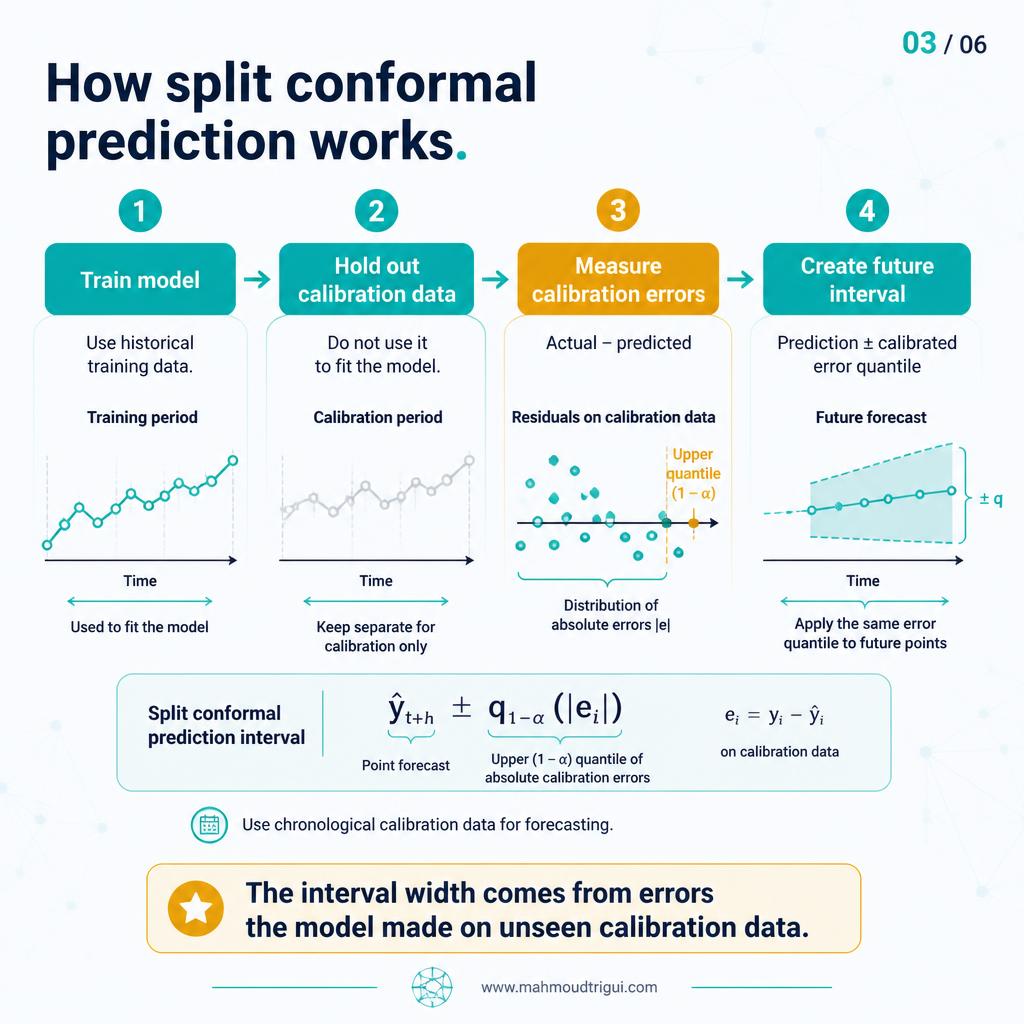
Conformal prediction does not require a special model. It takes a model you already trust for its point estimate and wraps it in a range built from measured errors. The basic split conformal workflow has four steps.
Step 1 — Train the model
Fit the forecasting model on historical training data. Conformal prediction does not change this model or require it to satisfy any distribution assumption.
Step 2 — Hold out calibration data
Reserve a separate set that was not used to fit the model. For forecasting, keep it chronologically later than the training data so the interval is built from errors the model genuinely could not have seen.
Step 3 — Measure calibration errors
Score the held-out set as actual minus predicted and take the error quantile you need, typically the upper residual quantile at the coverage level you care about.
Step 4 — Create the future interval
Apply that calibrated error quantile to each future prediction to produce an interval at the target coverage, such as 980 to 1,420 units around a 1,200 unit forecast.
The interval itself is then the point prediction plus or minus the calibrated error quantile:
ŷ ± q(calibration errors)
For a forecast of 1,200 units with a calibrated 90% interval, that becomes 980 to 1,420 units. The important detail for time series is step two: calibration data must be held out chronologically, not split at random, because a random split leaks future information into the interval.
What 90% Coverage Actually Means
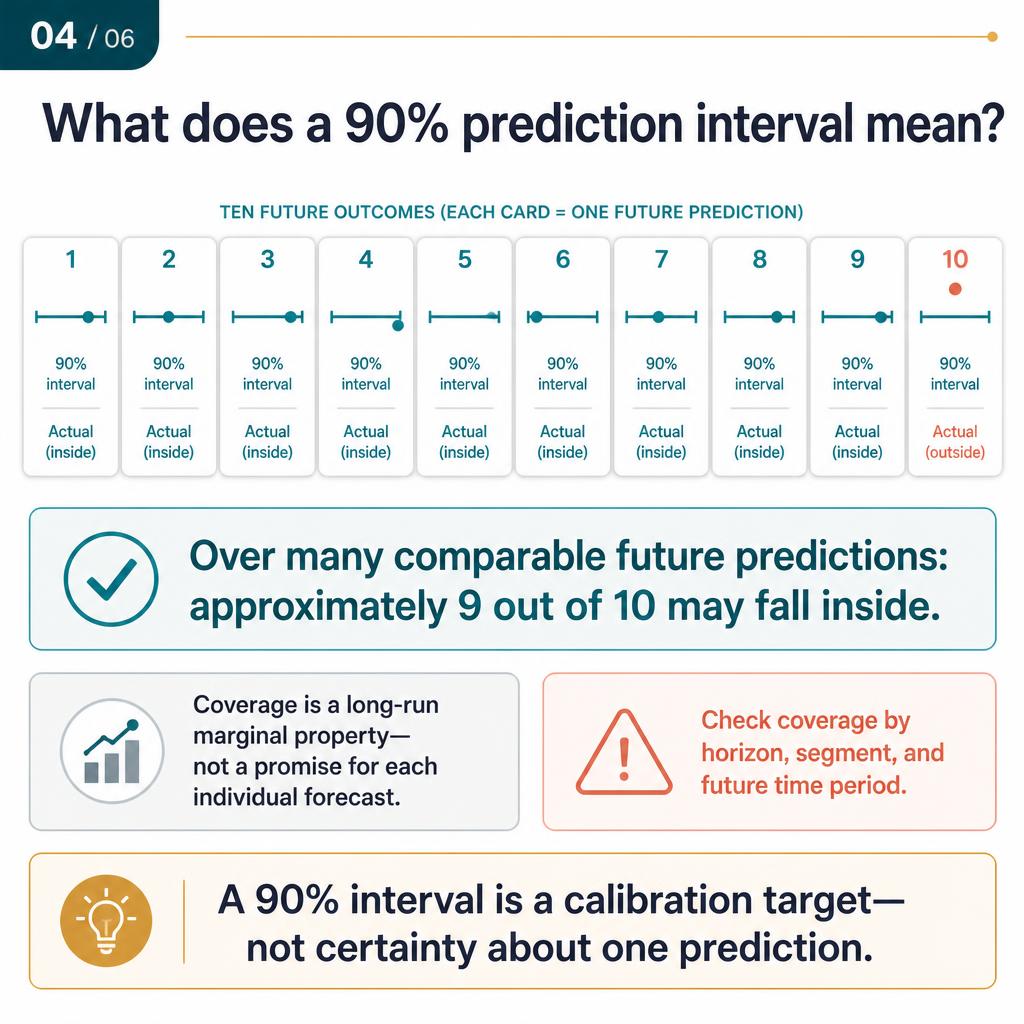
A 90% interval is a coverage target, not a promise about one forecast. Across many comparable future predictions, approximately nine out of ten actual outcomes may fall inside their interval. Any given forecast can still land outside it, and that is expected behaviour rather than a defect.
Coverage is a long-run marginal property. It says nothing about a single prediction, and it does not hold automatically inside every small subgroup. That is why the interval is only useful if you actually test it:
Test by horizon
Check coverage separately for each forecast horizon you actually use. An interval that averages out to target while failing at the horizon that drives planning is not calibrated for that decision.
Test by segment
Verify coverage inside the business segments that matter. A method can hold on aggregate and miss badly on a small but critical subgroup, which is where the cost concentrates.
Test by time period
Re-test on realistic future periods rather than a single historical slice, then re-check after deployment. Calibration is a property that can decay as the data shifts.
If coverage holds on average but breaks down at long horizons or in a key segment, the interval is not usable for the decision you built it for.
Where Basic Conformal Breaks
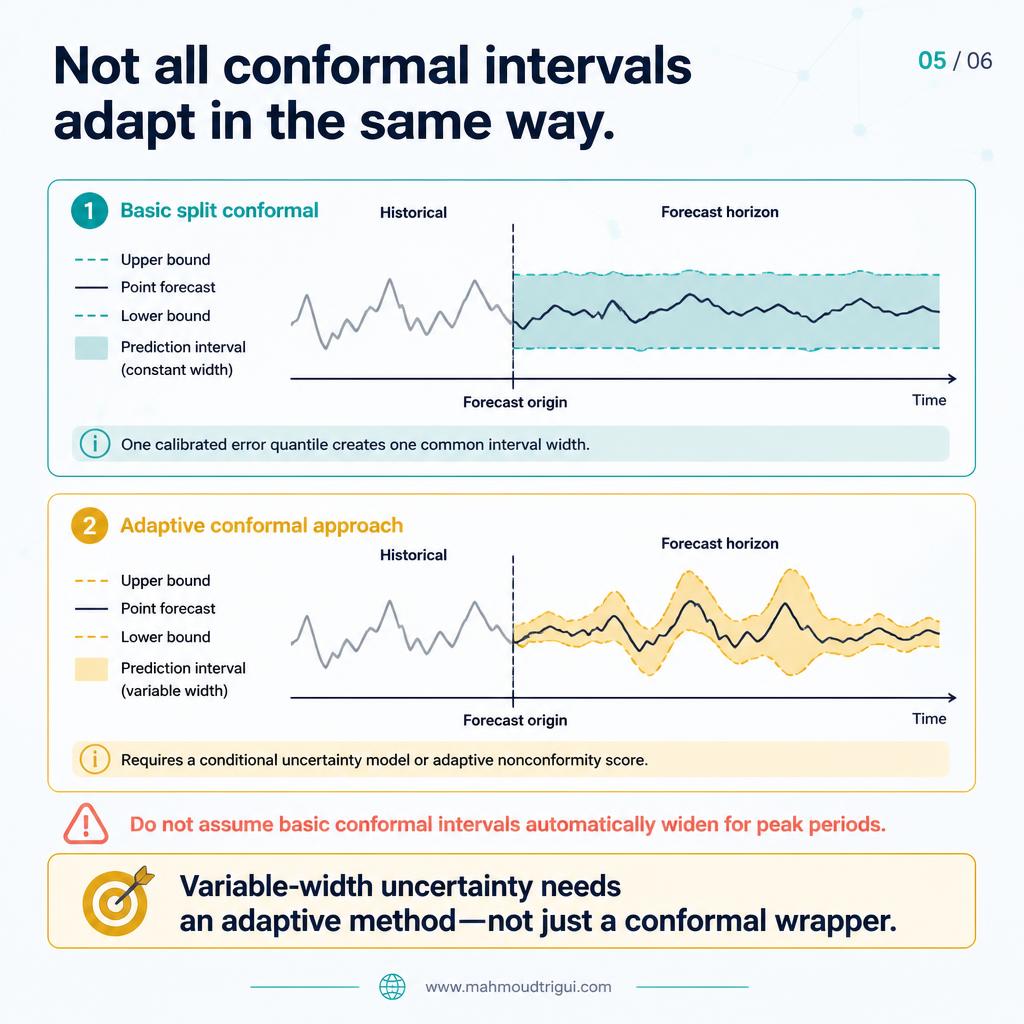
Split conformal prediction has one limitation that matters operationally: it applies a single calibrated error quantile to every prediction, so every interval comes out the same width. A calm Tuesday and a peak-demand Friday receive identical ranges even though their uncertainty is not identical.
Basic split conformal
One calibrated error quantile creates one common interval width. Simple and cheap, and the right default when uncertainty is genuinely stable across the range you forecast.
Adaptive conformal
Conformalized quantile regression or locally scaled conformal scores use a conditional uncertainty model, so intervals stay narrow in stable periods and widen when conditions are volatile. More work to build and to validate.
This is the distinction worth being precise about. Standard split conformal gives one common width; an adaptive method gives intervals that respond to local conditions. Neither is universally better — the adaptive approach costs more to build and to validate. The point is only that you should not assume a conformal wrapper widens intervals during peak periods when the base method does not.
Outcome
Once a calibrated interval is attached to the forecast, the conversation changes from whether a number is right to how much risk a decision can absorb. Capacity gets a staffing range instead of a single target, inventory gets a buffer sized to the interval, and the downside case becomes a scenario you planned for rather than a surprise.
It is equally important what a calibrated interval does not do. It does not make a weak model strong, it does not repair a flawed evaluation, and it does not remove the need to monitor whether coverage still holds once the data shifts. Backtest coverage on realistic future periods, by horizon and by segment, and keep checking it after deployment.
Key Takeaway
Design insight: Conformal prediction turns forecast uncertainty from an assumption into a measurement. It wraps an existing model in an interval built from errors on held-out calibration data, so a 90% interval targets 90% long-run coverage instead of promising certainty. Coverage is marginal rather than per-forecast, and basic split conformal applies one width everywhere. When uncertainty varies by context, adaptive methods such as conformalized quantile regression widen intervals where they should. Always backtest coverage by horizon and segment before decisions depend on it.
Related
Conformal Prediction: When the Model Is Uncertain →DLinear: Make a Simple Forecasting Baseline Fail First →Zero-Shot Forecasting Changes the Baseline →Purged Cross-Validation Is Not for Every Time Series →A predictive model is not a decision system | Mahmoud Trigui →The Most Dangerous Label in ML Looks Correct But Isn't →Not Every Analytics Question Is About What Drives Outcome →Aggregate → Forecast → Disaggregate →MLforecast Forecasting Pipeline — No More Feature Plumbing →Seed Sensitivity Is Part of Model Selection →
FAQ
What does a 90% conformal prediction interval actually mean?
It is a coverage target, not a guarantee for any single forecast. Across many comparable future predictions, roughly nine out of ten actual outcomes may fall inside their interval. Coverage is a long-run marginal property, so an individual forecast can still land outside its interval, and a method can hit 90% on average while missing badly inside a particular horizon or business segment.
How do you build a prediction interval with split conformal prediction?
Fit the forecasting model on training data, then hold out a separate calibration set that the model never saw. Score that set as actual minus predicted and take the error quantile matching your coverage target. Apply it to each future prediction as prediction plus or minus that quantile. For forecasting, the calibration data must be chronologically later than the training data, because a random split leaks future information into the interval.
Why do basic conformal intervals have the same width everywhere?
Split conformal uses a single calibrated error quantile for every prediction, so one common width is applied across the whole forecast range. That is a reasonable default when uncertainty is genuinely stable, but it understates risk in volatile periods and overstates it in calm ones. When uncertainty varies by context, you need an adaptive method such as conformalized quantile regression or locally scaled conformal scores.
How do you check that conformal prediction intervals are well calibrated?
Backtest coverage on realistic future periods rather than one historical slice, and check it separately by forecast horizon and by business segment. Then re-check after deployment, because calibration decays as data shifts. If coverage holds on average but breaks down at the horizon that drives planning, the interval is not usable for that decision.