I generate EDA with AI. Then I delete most of it.
AI is excellent at breadth — a fast first-pass inventory of distributions, missingness, and trends. Deciding which patterns deserve real analysis is still human work, and that is where the depth comes from.
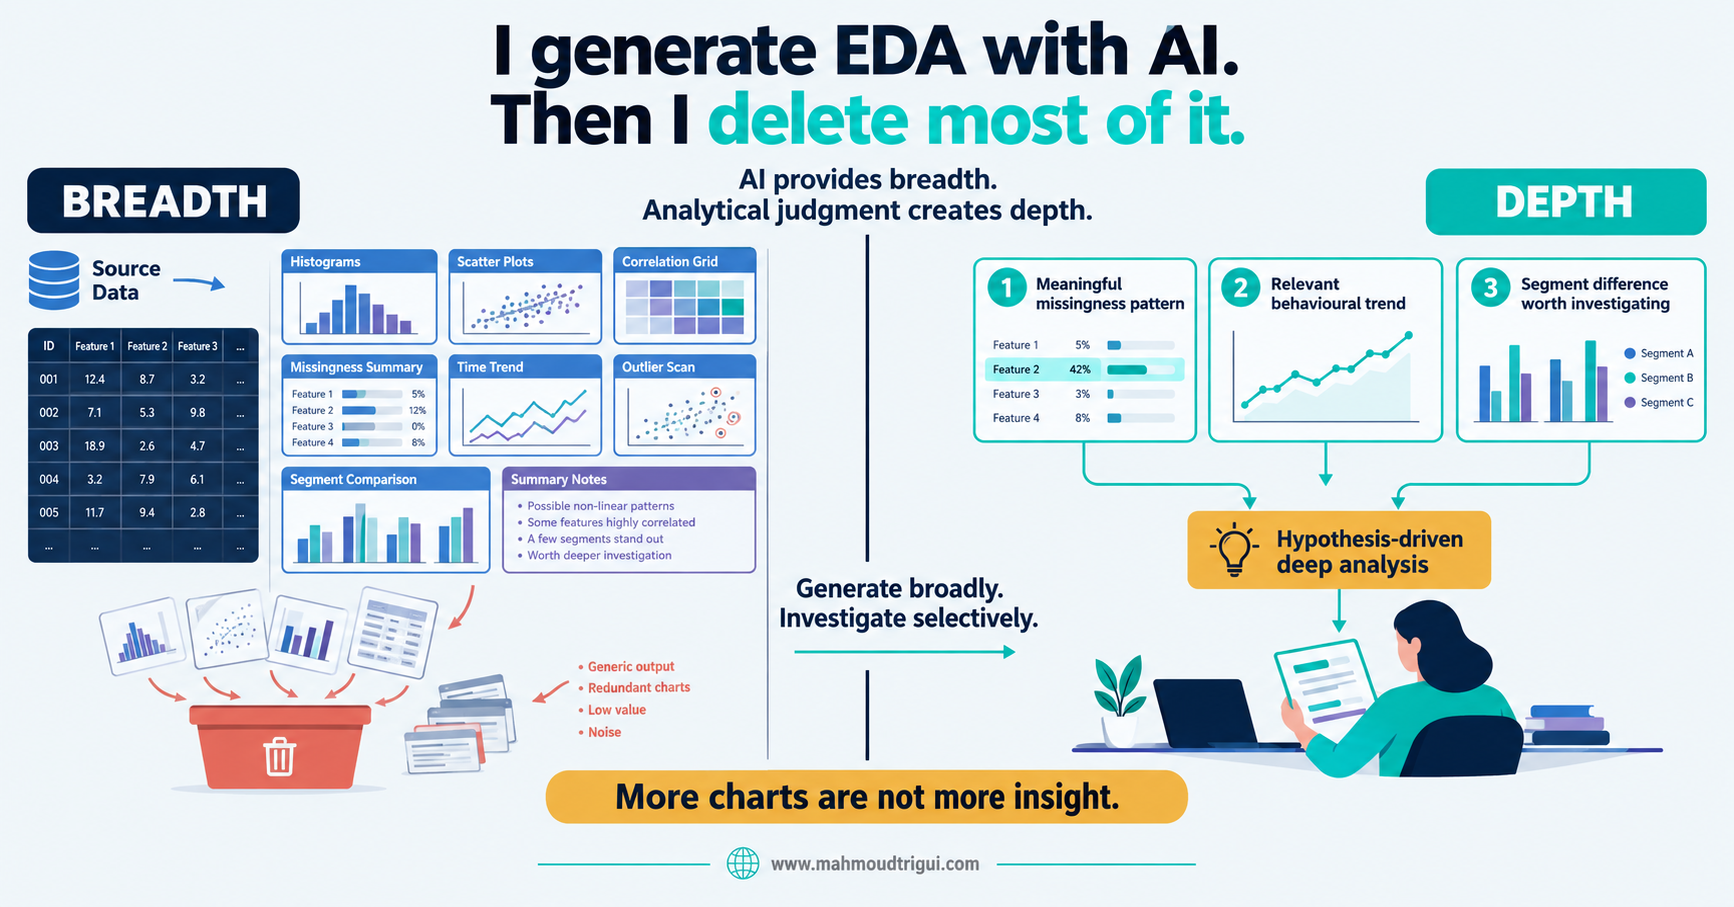
TL;DR: AI provides breadth; analytical judgment creates depth. Use AI to generate a fast first-pass EDA, then delete most of it and keep the few patterns worth investigating. A generic histogram can be correct and irrelevant — only domain context tells you whether a missing-value pattern is a process change, an eligibility rule, a data-quality issue, or a real predictive signal. More charts are not more insight.
The Problem
Exploratory data analysis (EDA) has always been a breadth problem. Before I can trust any model, I need a fast, honest read of the data: how each variable is distributed, where the gaps are, how the target is balanced, what might be an outlier, what correlates with what, and how things move over time.
That first pass used to take days. Now an AI assistant produces most of it in minutes — a first-pass inventory of distributions, missing-value patterns, target balance, potential outliers, correlations, time trends, and segment summaries.
But reconnaissance is not analysis. A generic histogram can be technically correct and completely irrelevant. A broad correlation matrix can look impressive and reveal nothing actionable. Breadth on its own does not tell me what matters.
The Approach
I use AI for the first pass, and I expect to throw most of it away. The workflow is deliberately split between generation and judgment:
Generate a broad first pass
Let the assistant produce the full inventory quickly — distributions, missingness, target balance, outliers, correlations, time trends, and segment summaries. Speed at breadth is the whole point.
Remove generic or irrelevant output
Delete anything that does not connect to a decision. A chart nobody would act on is noise, even when it is correct.
Keep the few patterns worth investigating
Flag the handful of signals that deserve a deeper look: an unexpected missingness pattern, a behaviour that shifts over time, a segment that stands out.
Build custom, hypothesis-driven analysis
Around the kept signals, write bespoke, question-first analysis. This part is not outsourced, because it needs domain context and an explicit hypothesis.
Domain context is what turns a chart into a finding. A missing-value chart may be interesting on its own, but only domain knowledge can tell me whether it reflects a process change, an eligibility rule, a data-quality issue, or a useful predictive signal. The AI can surface the pattern; it cannot decide what the pattern means for the business.
Outcome
The result is fewer charts, not more — but every one of them is tied to a real question. The AI scans a larger surface area faster, so I spend my own time on interpretation instead of producing boilerplate plots. The output is a shorter, sharper EDA that a stakeholder can actually use.
The goal is not more charts. It is fewer charts with stronger questions behind them.
Key Takeaway
Design insight: AI provides breadth; analytical judgment creates depth. Use AI to generate a fast first-pass EDA, then delete most of it and keep the few patterns worth investigating. A generic histogram can be correct and irrelevant — only domain context tells you whether a missing-value pattern is a process change, an eligibility rule, a data-quality issue, or a real predictive signal. More charts are not more insight.
Related
AI Pre-Flight Review Before You Write Model Code →AI Can Review Feature Code. It Cannot Approve It →isnull() Is a Feature — Missingness as a Signal →Not Every Analytics Question Is About What Drives Outcome →A Valid LLM Response Is Not Necessarily a Safe Decision →The AI Replaced the Training Backlog, Not the Classifier →One Row Is a Modelling Decision: Customer or State? →Automate Maintenance, Keep Judgment Human →
FAQ
What is the key takeaway from "AI-Assisted EDA: Breadth vs Depth in Data Analysis"?
AI provides breadth; analytical judgment creates depth. Use AI to generate a fast first-pass EDA, then delete most of it and keep the few patterns worth investigating. A generic histogram can be correct and irrelevant — only domain context tells you whether a missing-value pattern is a process change, an eligibility rule, a data-quality issue, or a real predictive signal. More charts are not more insight.
Who wrote this and what is it about?
This was written by Mahmoud Trigui, Senior Data Scientist. AI-assisted EDA is fast at breadth, but analytical judgment creates depth. How to generate a first-pass EDA with AI, then keep only the patterns that matter.