K-Means Reduces the Scale; Hierarchy Explores Structure

K-means was not the final segmentation step — it was the compression layer that made structure-finding feasible on a large telecom customer base.
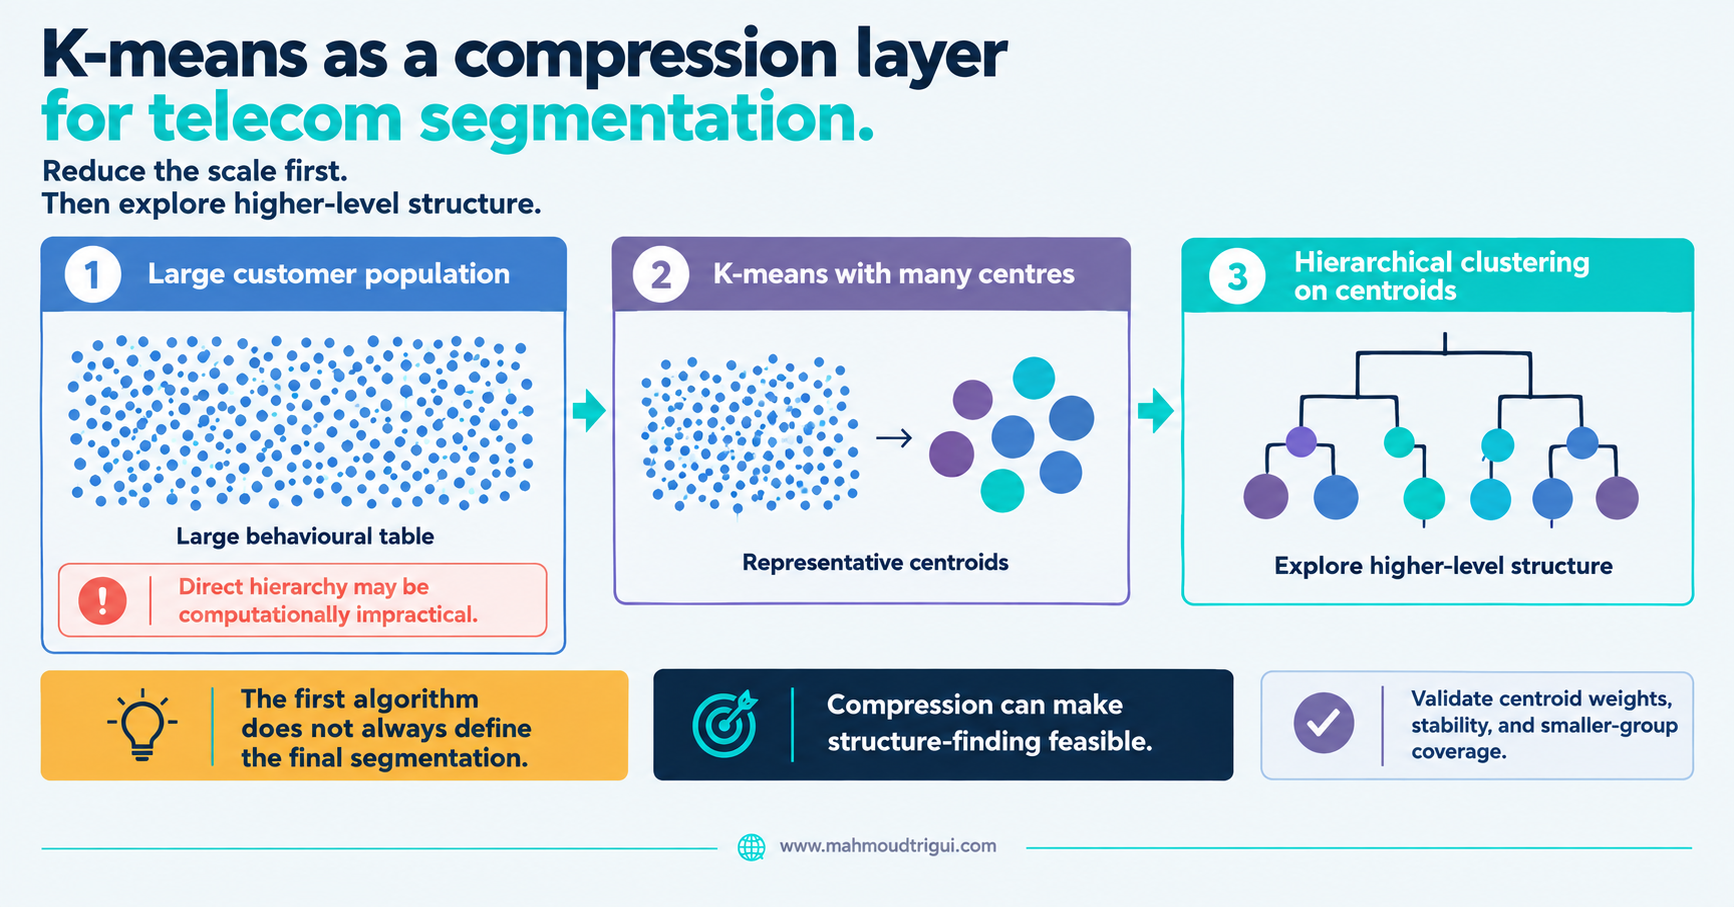
Many K-Means Centres Representative Centroids Hierarchy on Centroids Validate the Result
K-means as a compression layer for telecom segmentation - reduce the scale first, then explore higher-level structure with hierarchical clustering on centroids

TL;DR: K-means as a compression layer makes structure-finding feasible on large populations: reduce the base to representative centroids, run hierarchical clustering on them to explore higher-level structure, then validate centroid weights, stability, and coverage of smaller groups — because the first algorithm does not always define the final segmentation.

The Problem

In large telecom customer segmentation, some clustering methods become difficult to apply directly to the full population. Hierarchical clustering can provide useful nested structure, but its memory and computational requirements grow quickly as the number of observations increases.

K-means is much easier to scale. But used alone, it may not provide the level of hierarchical interpretation needed for the final segmentation.

The Approach

The workflow combined both methods. First: use K-means with many centres to represent a large customer base through a smaller set of centroids. Then: apply hierarchical clustering to those centroids to explore higher-level structure.

Compression is a design choice, not magic

Compression can hide rare patterns, and the hierarchy is built on representatives rather than every original customer. This is not automatically the best approach for every dataset.

Validate the compressed result

Check segment sizes, inspect within-segment variation, evaluate stability, consider centroid weights, and test whether important smaller groups are being lost.

Outcome

The architectural idea is useful: one algorithm does not always have to be the final model. Sometimes its role is to produce a manageable representation for the next analytical step.

K-means reduced the scale. Hierarchy helped explore the structure.

Key Takeaway

Design insight: K-means as a compression layer makes structure-finding feasible on large populations: reduce the base to representative centroids, run hierarchical clustering on them to explore higher-level structure, then validate centroid weights, stability, and coverage of smaller groups — because the first algorithm does not always define the final segmentation.

FAQ

What is the key takeaway from "K-Means Reduces the Scale; Hierarchy Explores Structure"?

K-means as a compression layer makes structure-finding feasible on large populations: reduce the base to representative centroids, run hierarchical clustering on them to explore higher-level structure, then validate centroid weights, stability, and coverage of smaller groups — because the first algorithm does not always define the final segmentation.

Who wrote this and what is it about?

This was written by Mahmoud Trigui, Senior Data Scientist. K-means as a compression layer: reduce a large telecom customer base to centroids, then run hierarchical clustering on them to explore higher-level structure.

Comments

Machine Learning Feature Engineering MLForecast Time Series Decomposition Forecasting LightGBM XGBoost Catboost Clustering Segmentation NLP LLMs Web App R Markdown SQL Oracle DB SAS-Guide SAS E-Miner Dataiku BigQuery GCP Python R CRISP-DM Hypothesis Testing ANOVA Data Analytics Dimensionality Reduction Recommendation System Network Analysis Geospace Analysis Spatial Data Embedding Sampling Techniques Decision Rules Data Storytelling CVM Churn Fraud Detection Sentiment Analysis Topic Modeling IBM Watson PowerBI Looker Studio VBA Statistical Learning Ensemble Modeling Stacking Cross-Validation Profiling ABT Construction Plumber Tidyverse Shiny Prophet Deep Learning Scikit-Learn JSON SAS Programming Git VS Code CSS Styling Automated Reporting Outlier Detection Temporal Clustering Startup Survival Pre-Valuation Modeling K-Means Decision Trees Data Science Predictive Modeling SVM LDA Text Classification Weight Prediction Pattern Recognition Real-Time Detection Community Detection Pipeline Automation Data Quality Checks Data Reliability Specification Mapping Business Strategy Marketing Campaigns Try & Buy Frameworks KPI Dashboards Network Quality Sales Analytics Mentoring Statistics Lecturer Remote Work Hybrid Work Consulting Contract Full-Time Freelance Sofrecom Orange Group Tunisia Telecom Kiota Intelligence VC Analytics Series A Prediction Pre-Valuation Modeling Production ML Applied AI Prompt Engineering Business Forecasting Decision Systems Graph Analytics Household Detection Multi-SIM Detection FTTH Forecasting Audit Extraction Infrastructure Classification Pydantic GPT-4 OpenAI API Base64 Classification Zindi Codementor LAAS-CNRS ESSAI MIT xPRO Tunisia ML Competition Cell Tower Analysis Uber Logistics Uber Cape Town Necessary Condition Analysis Behavioral Signals Spike Smoothing Observation Unit Design Dendrogram Ward Clustering VIF Target Encoding Machine Learning Feature Engineering MLForecast Time Series Decomposition Forecasting LightGBM XGBoost Catboost Clustering Segmentation NLP LLMs Web App R Markdown SQL Oracle DB SAS-Guide SAS E-Miner Dataiku BigQuery GCP Python R CRISP-DM Hypothesis Testing ANOVA Data Analytics Dimensionality Reduction Recommendation System Network Analysis Geospace Analysis Spatial Data Embedding Sampling Techniques Decision Rules Data Storytelling CVM Churn Fraud Detection Sentiment Analysis Topic Modeling IBM Watson PowerBI Looker Studio VBA Statistical Learning Ensemble Modeling Stacking Cross-Validation Profiling ABT Construction Plumber Tidyverse Shiny Prophet Deep Learning Scikit-Learn JSON SAS Programming Git VS Code CSS Styling Automated Reporting Outlier Detection Temporal Clustering Startup Survival Pre-Valuation Modeling K-Means Decision Trees Data Science Predictive Modeling SVM LDA Text Classification Weight Prediction Pattern Recognition Real-Time Detection Community Detection Pipeline Automation Data Quality Checks Data Reliability Specification Mapping Business Strategy Marketing Campaigns Try & Buy Frameworks KPI Dashboards Network Quality Sales Analytics Mentoring Statistics Lecturer Remote Work Hybrid Work Consulting Contract Full-Time Freelance Sofrecom Orange Group Tunisia Telecom Kiota Intelligence VC Analytics Series A Prediction Pre-Valuation Modeling Production ML Applied AI Prompt Engineering Business Forecasting Decision Systems Graph Analytics Household Detection Multi-SIM Detection FTTH Forecasting Audit Extraction Infrastructure Classification Pydantic GPT-4 OpenAI API Base64 Classification Zindi Codementor LAAS-CNRS ESSAI MIT xPRO Tunisia ML Competition Cell Tower Analysis Uber Logistics Uber Cape Town Necessary Condition Analysis Behavioral Signals Spike Smoothing Observation Unit Design Dendrogram Ward Clustering VIF Target Encoding